Ocean City, MD Real Estate Blog

By Local Experts

Ocean City Real Estate Blog

Welcome to the Ocean City Real Estate Blog, your go-to resource for expert insights, local market trends, and community highlights along Maryland’s Eastern Shore. Curated by The Fritschle Barker Group, our posts cover everything from buying and selling tips to neighborhood guides and lifestyle features—helping you make informed decisions and discover the best of Ocean City, West OC, Assateague, and beyond.

July 11, 2026

Maryland Nonresident Withholding Tax for Ocean City Sellers

Settlement table paperwork for an out-of-state seller closing on an Ocean City MD condo

The Maryland Withholding Tax Every Out-of-State Ocean City Seller Should Know About

If you live outside Maryland and you are getting ready to sell your Ocean City condo or beach home, there is a line item waiting at settlement that catches a surprising number of sellers off guard. Maryland can require the settlement company to withhold part of your proceeds at closing simply because you are not a Maryland resident.

It is not a penalty. It is not necessarily lost money. But if nobody explains it to you ahead of time, watching a five-figure sum come off your settlement sheet is a rough way to learn about it.

We walk out-of-state sellers through this on a regular basis, especially when they are selling their Ocean City condo after years of using it as a second home, rental property, or family beach place. So here is the honest version of that conversation.

Quick Answer

Maryland requires settlement companies to withhold state income tax from many nonresident sellers at closing. As of 2026, the withholding rate is 8.75% for individuals, estates, and trusts, and 8.25% for business entities. The withholding is generally applied to the seller’s “total payment,” which many sellers think of as their estimated net proceeds, unless the seller applies in advance for an exemption or reduction.

That last part is the part that matters most. The withholding is a prepayment toward your Maryland tax, not an extra tax, and you may be able to reduce it before settlement if you file the right form early enough.

The withholding is not the problem. Finding out too late is.


What Is the Maryland Nonresident Withholding Tax?

Maryland nonresident withholding is state income tax collected at settlement when a seller who lives outside Maryland sells real estate located in Maryland. The settlement company withholds the money before the seller receives the proceeds and sends it to the state as part of the closing process.

Maryland has required this for years. The reasoning is practical rather than punitive: when a nonresident sells Maryland property and may owe tax on a gain, the state wants to make sure the tax is accounted for before the seller leaves the transaction. Instead of simply trusting every out-of-state seller to file later, Maryland collects an estimated amount up front.

Think of it loosely like withholding from a paycheck. Money is set aside against a tax bill that gets finalized later. If too much was withheld, you generally recover the difference through your Maryland nonresident tax return.

This is one of those settlement details that does not always get enough attention early in the process, which is why it belongs on the list of mistakes sellers make in Ocean City when they are preparing to list.


How Much Does Maryland Withhold From a Nonresident Seller?

In 2026, Maryland’s nonresident withholding rate is 8.75% for individual sellers, estates, and trusts, and 8.25% for nonresident business entities such as certain LLCs, corporations, and partnerships.

Here is where the number surprises people. The withholding is not automatically figured on your profit. Without an approved exemption or reduction, it is generally calculated on the seller’s “total payment,” which many sellers experience as a withholding from their estimated net proceeds.

Seller Type 2026 Withholding Rate Generally Applied To
Individual, estate, or trust 8.75% Total payment, often experienced by sellers as estimated net proceeds
Business entity, such as certain LLCs, corporations, or partnerships 8.25% Total payment, often experienced by sellers as estimated net proceeds

Here is a simplified illustration. Say an individual seller sells a paid-off Ocean City condo for $500,000. Without an exemption or reduction on file, the withholding could land in the low forty-thousands. That is real money to have parked with the state while everything gets reconciled later.

The exact calculation belongs with your CPA and settlement company. The Realtor’s job is not to calculate your tax. The Realtor’s job is to make sure this topic is on the table early enough that you can plan around it, ask the right questions, and avoid being surprised at closing.


Can You Reduce or Avoid the Withholding?

Yes. Maryland allows nonresident sellers to apply for a Certificate of Full or Partial Exemption using Form MW506AE. When approved, that certificate can allow the settlement company to withhold based on the actual taxable gain instead of the broader estimated proceeds figure.

That can make a major difference. If you bought an Ocean City condo years ago, used it seasonally, rented it occasionally, made improvements, paid selling expenses, and still have an adjusted basis to account for, your actual taxable gain may be very different from the sales price or the estimated net proceeds.

The catch is timing. The Maryland Comptroller must receive the MW506AE application and required documents no later than 21 days before closing. That is not a casual suggestion. If you miss the window, the full withholding may (and likely will) apply at settlement, even if you would have clearly qualified for a reduction.

This is why nonresident withholding should be discussed before you go under contract, not after. If you are still early in the process and trying to understand timing, pricing, preparation, and your likely net, start with a broader plan for common questions about selling before you are staring at a settlement deadline.


Who This Usually Affects in Ocean City

Oceanfront condo buildings in Ocean City MD often owned by out-of-state second-home and rental owners

This rule matters in Ocean City more than it does in many year-round Maryland markets because so many local properties are owned by people who live somewhere else. Ocean City has a large number of second-home owners, vacation-rental owners, inherited-property sellers, former Maryland residents, and out-of-state LLC owners.

That is not unusual here. It is part of how a resort market works.

A direct oceanfront condo, a bayside waterfront unit, a downtown oceanfront condo on the boardwalk, and a North Ocean City investment property may all have different buyer pools and pricing dynamics, but the same withholding issue can show up at closing if the seller is not a Maryland resident. That is one reason building-level knowledge matters. The financial details of a sale are rarely just about the contract price.

If you are trying to estimate what your condo is worth, you also want to understand what happens after the price is negotiated. Value is one thing. Net outcome is another.


What If the Property Was a Rental?

If the property was rented, you should speak with your CPA early. The MW506AE exemption application asks whether the property has been used for rental or commercial purposes, and Maryland can deny the application if required nonresident rental income tax returns were not filed.

That does not mean every rental owner has a problem. It means the rental history needs to be handled correctly.

This is especially relevant in Ocean City, where many sellers have owned income-producing beach condos for years. Some owners rented heavily. Some rented lightly. Some used a local company. Some self-managed. Some mostly used the property personally and only rented during peak weeks. Those differences can matter when your accountant reviews basis, depreciation, prior filings, and the sale itself. Many of those owners weighed the same question when they first bought the place: whether the condo was a second home or an investment property to their lender.


If you have been using the property as a rental, the right time to gather your rental history, improvement records, depreciation schedules, and prior returns is before settlement pressure builds.


What Forms Are Involved?

There are a few Maryland form numbers worth knowing, even though your CPA and settlement company should guide the actual process.

Form MW506AE is the application for a full or partial exemption from withholding. This is the form that matters before closing if you are trying to reduce the amount withheld at settlement.

Form MW506NRS is the return the settlement agent files at closing to report and remit the withholding.

Your Maryland nonresident income tax return is where the sale is ultimately reconciled. If the amount withheld is more than your actual Maryland tax liability, the overage is typically recovered through that return.

For higher-end sellers, there is one more current rule worth knowing. If the property sells for $1.5 million or more, Maryland no longer allows the quick tentative-refund route for that sale. Any overpayment has to be claimed through the annual Maryland tax return instead. In plain English, that can mean waiting longer to recover excess withholding on a larger sale.

Ocean City has enough high-value sales that this is not a technical footnote. It can matter for luxury condo sellers, waterfront-home sellers, and owners evaluating whether a sale, reinvestment, or 1031 tax-deferred exchange is the smarter next move.


What About a 1031 Exchange?

A 1031 exchange can be part of the conversation for some nonresident sellers, especially if the Ocean City property has been used as an investment or rental property. It does not automatically eliminate every tax issue, and it has its own rules, deadlines, qualified-intermediary requirements, and reinvestment standards.

The bigger point is timing. If you are even considering a 1031 exchange, you should raise that with your CPA, exchange intermediary, settlement company, and Realtor before the property goes under contract. Waiting until the closing file is already moving can limit your options quickly.

This is also where local real estate advice and tax advice need to work together. A Realtor can help you understand buyer demand, rental potential, pricing strategy, and local market timing. Your CPA and exchange team need to confirm whether the tax strategy actually fits your situation.


How This Connects to Your Bigger Seller Plan

Nonresident withholding is just one part of the seller’s bigger financial picture. You still need to understand pricing, condo fees, mortgage payoff, transfer charges, settlement costs, rental income, repairs, staging, timing, and market demand.

That is why it is dangerous to evaluate a sale only by asking, “What can I get for it?” A better question is, “What is my likely net outcome, how long will it take, and what could surprise me between contract and closing?”

For some sellers, the bigger issue is the withholding. For others, it is a delayed rental-income reconciliation, a condo association requirement, a buyer inspection request, or misunderstanding closing costs in Ocean City. For some condo owners, it may even connect to what condo fees really cover because buyers increasingly want to understand building health before they commit.

A smooth sale is usually not the result of one brilliant move. It is the result of handling a dozen small things early, before they become expensive, stressful, or rushed.


Why This Matters More in Ocean City Than Almost Anywhere in Maryland

Ocean City is not a typical Maryland real estate market. A huge share of condos and beach homes are owned by people who live elsewhere, use the property seasonally, or rent it when they are not here. That means the Maryland nonresident withholding rule touches a large percentage of local sellers.

If you have owned a second home or income property at the beach for years, there is a good chance this rule applies to you. There is also a good chance no one has explained it clearly unless you have already sold Maryland property from out of state.

The sellers who handle it smoothly are usually the ones who know about it before they list. The sellers who get frustrated are usually the ones who find out when the settlement sheet arrives.

Which one you are is mostly a function of timing and good advice.

If you are preparing to sell, it is worth reviewing the current Ocean City market report so you understand buyer behavior, pricing momentum, and timing before you make decisions around list price and closing strategy. It is also worth talking through the larger picture with one of the top agents for buying and selling in the local market, because the details of your building, view, condition, rental history, and owner profile can all affect the best path forward.


Frequently Asked Questions

Is the Maryland nonresident withholding an extra tax on my sale?

No. It is a prepayment toward the Maryland income tax you may owe on the sale. If the amount withheld exceeds your actual Maryland tax liability, you generally recover the difference when you file the appropriate Maryland nonresident return.

What is the Maryland nonresident withholding rate in 2026?

For 2026, the rate is 8.75% for individuals, estates, and trusts, and 8.25% for nonresident business entities. The withholding is generally applied to the seller’s total payment unless an approved exemption or reduction changes the calculation.

How do I get the withholding reduced?

You apply through Maryland Form MW506AE, the Application for Certificate of Full or Partial Exemption. If approved, the withholding can be based on your taxable gain instead of the broader proceeds figure.

When does Form MW506AE need to be filed?

The Maryland Comptroller must receive Form MW506AE and all required documents no later than 21 days before closing. Because that deadline can arrive quickly once a property goes under contract, sellers should involve their CPA and settlement company early.

What happens if I miss the 21-day deadline?

If the exemption application is not received on time, the full withholding may apply at closing. You can still reconcile the withholding later through your Maryland nonresident return, but you may lose the opportunity to reduce the amount withheld up front.

Do I still have to file a Maryland tax return after the sale?

Yes. The withholding does not replace your Maryland tax return. You file the appropriate Maryland nonresident return for the year of the sale to report the transaction and reconcile the amount withheld.

Does this apply if I sell through an LLC?

It can. Maryland applies a separate 8.25% withholding rate to nonresident entities, including certain LLCs, corporations, and partnerships. Confirm your entity status and filing requirements with your accountant.

Should I consider a 1031 exchange?

Possibly, if the property qualifies as investment or rental property and you plan to reinvest in other qualifying real estate. A 1031 exchange has strict timing and structure requirements, so it should be discussed with your CPA and qualified intermediary before the sale is underway.


Why You Can Trust This Guide

The Fritschle Barker Group has been guiding buyers and sellers through Ocean City and the surrounding Eastern Shore for decades. Grant Fritschle is a second-generation Ocean City Realtor with 29 years in this market and more than 2,000 personal transactions, a large share of them involving out-of-state owners selling second homes, oceanfront condos, waterfront properties, and rental properties.

Because many of those clients rented their units, Grant also brings the perspective of Central Reservations, the family vacation-rental management company, on how rental history can intersect with a sale. That combination matters in Ocean City because selling a beach property is often not just a pricing decision. It can involve rental income, tax timing, condo association details, settlement logistics, buyer demand, and the owner’s next move.

We coordinate directly with your settlement company and your accountant on the withholding timeline so nothing gets sprung on you at the closing table. As one of our out-of-state sellers put it after closing:

“This was the least stressful experience we have had to date selling property.”

That came from Jim and Darlene L., who sold with us from out of state.

Information here reflects 2026 Maryland Comptroller rules and is general education, not tax or legal advice. Confirm your specifics with a licensed CPA and your settlement company.

Authoritative sources: Comptroller of Maryland Form MW506AE, Comptroller of Maryland 2026 Tax Alert on nonresident real property withholding, and Maryland Form MW506NRS.


Thinking About Selling an Ocean City Property From Out of State?

If you are considering selling an Ocean City condo, beach home, rental property, or investment property from outside Maryland, the right starting point is not just a price estimate. It is a full seller conversation around value, timing, market demand, rental history, settlement costs, tax-related planning questions, and what may show up on your net sheet before closing.

For a more specific read on your property, building, or investment goals, connect with Grant Fritschle and The Fritschle Barker Group before you list. A little planning early can prevent a very expensive surprise later.

Best Realtors in Ocean City MD

Your Top Ocean City, MD Real Estate Agents

Today, they are recognized nationally as a top-performing group of charismatic, skilled Agents deeply connected to the vibrant towns of the Eastern Shore. More than agents, they are trusted advisors and community advocates, blending local knowledge with national strategy to deliver exceptional results.

The Fritschle Barker Group at Keller Williams Realty of Delmarva adheres to all Fair Housing Act guidelines and NAR ethical standards.

July 2, 2026

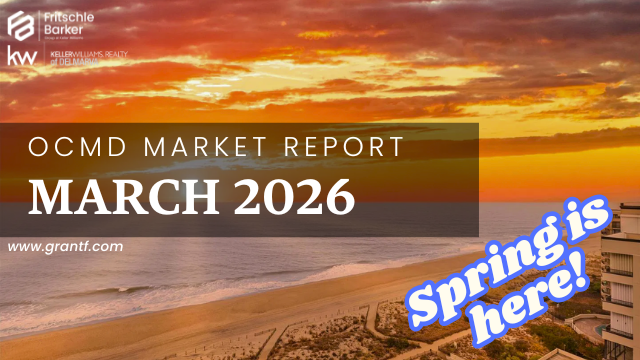
Ocean City MD Real Estate Market Report | June 2026

Ocean City MD Real Estate Market Report June 2026 showing condo prices, home values, inventory trends, and market activity

Ocean City, MD Real Estate Market Report | June 2026

Last Updated: July 2, 2026. Go read our most recent market report for July 2026! Based on closed Bright MLS sales in the Direct Oceanfront, Oceanfront Indirect View, Ocean Block, Bayside Interior, Bayside Waterfront, and West Ocean City MLS areas (80 through 85), along with current active, pending, and under-contract inventory.

Monthly Letters From the Market: a better way to understand the Ocean City real estate market, with more insight, more context, and more data from local experts.

Every month, the headlines try to summarize the Ocean City real estate market in a sentence or two. They focus on prices, inventory, interest rates, luxury sales, or national housing trends, and they are usually accurate as far as they go. What they rarely answer is the question buyers and sellers actually care about: what does all of this mean for me?

That is the purpose of these reports. The goal is not to publish another pile of MLS statistics, but to interpret what happened, explain why it happened, and help buyers, sellers, investors, and homeowners understand what those changes mean for their next decision. Data without context is just noise, so every report is built around one simple idea: the numbers matter, and understanding them matters even more.

If You Only Read The Headlines, June Looks Like A Blockbuster Month

An 83% jump in sales volume. Nearly $73.4 million in closed sales. An average sale price approaching $582,000. Twelve properties selling for more than $1 million, and a $3.9 million sale leading the way. Stop there, and you might reasonably conclude that every corner of the Ocean City market suddenly accelerated.

That is not what happened, and it is exactly why context matters.

June was a strong month, but it was also a reminder of how a small number of high-end sales can dramatically influence the averages and make the market look stronger across the board than it actually was. That is one of the challenges of a resort market, where a handful of exceptional waterfront and luxury properties can meaningfully shift the headline statistics.

The more interesting story was not happening at the very top of the market. It was happening where most buyers and sellers actually live. The median sale price climbed to $479,500, up 7.3% from May and 9.6% compared to June of last year, and the average price per square foot rose right alongside it. When those two numbers move together, they tell us something the average never could: appreciation remains broad-based, demand is still healthy, and the market continues rewarding people who approach it with realistic expectations instead of yesterday's assumptions.

If I had to summarize June in a single thought, it would be this. The luxury market captured the headlines, and the median told the real story. To me, that is encouraging. Healthy markets are not built on a handful of extraordinary sales; they are built on consistent demand across the broader market. After several years of dramatic swings, June felt like a market settling into a sustainable rhythm, one where preparation, pricing strategy, and local knowledge matter more than hype.


Quick Answer: How Is The Ocean City Real Estate Market Performing?

Quick Answer

The Ocean City and West Ocean City real estate market recorded 126 closed sales in June 2026, a preliminary figure that will likely increase as delayed settlements are reported. That is essentially in line with May's revised total of 130 sales, which tells us buyer activity remains remarkably consistent.

The median sale price increased to $479,500, while average price per square foot climbed to $443, reinforcing that appreciation continues across much of the market rather than being driven exclusively by luxury properties. Total dollar volume reached $73.4 million, but that figure was heavily influenced by several exceptionally large transactions and should be read with that in mind.

The broader takeaway is more useful than any headline. Buyers are still buying, well-priced properties are still selling quickly, negotiation has become more disciplined, and the market continues behaving the way a healthy, balanced market should.

Key Takeaways

  • June recorded 126 closed sales (preliminary), essentially matching May's revised total of 130.
  • Median sale price increased 7.3% month over month and 9.6% year over year to $479,500.
  • Average price per square foot reached $443, up 7.0% year over year, confirming appreciation remains broad-based.
  • Twelve sales exceeded $1 million, double May's total, significantly influencing the average price and total volume.
  • Approximately 41% of purchases closed with cash, reflecting the month's luxury-heavy sales mix.
  • Buyers became more selective, with only 25% of sales closing at or above asking price.
  • Inventory continues giving buyers more choices while rewarding sellers who price realistically from the start.

If you are weighing a move, the guides on what your Ocean City condo is worth and what $500,000 actually buys here are useful companions to this report.


June In One Minute

If you are short on time, here is the month in a few lines. Median prices kept climbing, and price per square foot confirmed the appreciation was genuine. Luxury sales amplified the headlines but did not define the broader market. Buyers negotiated more confidently than they did a month ago, inventory kept creating opportunities for prepared buyers, and sellers who priced strategically still achieved excellent results.


Grant's Market Minute

One of the first things I do every month is ignore the average sale price. That probably sounds backward coming from someone who spends much of his career analyzing market statistics, but averages can be deceptive in a resort market like Ocean City. A single luxury closing can move the average, and a handful of waterfront sales can reshape it entirely. That is exactly what happened in June.

The upper end of the market had an exceptional month. Oceanfront residences changed hands at impressive prices, several seven-figure transactions closed, and one remarkable property sold for nearly $4 million. Those sales deserve attention because they are an important part of our market. They are just not the whole market.

What caught my attention was not the average. It was the combination of the median sale price and the increase in price per square foot. When those two measurements rise together, they tell me appreciation is reaching beyond the luxury segment, and they are a far better reflection of what the typical Ocean City property is doing.

The second thing I noticed was buyer behavior. Buyers have not disappeared and they have not become hesitant. They have simply become more disciplined. One Gateway Grand residence sold at full asking price after just three days on the market, while the largest sale of the month closed at roughly 85% of its original asking price. Those are not contradictory stories. They are two examples of the same market, one where buyers still pay full price when a property is positioned correctly and ask much tougher questions when it is not.

From my perspective, that is one of the healthiest developments we have seen in a while. Markets do not stay healthy because every property sells immediately. They stay healthy because buyers and sellers gradually find a balance, and June felt very much like that kind of market.


The Story Behind The Statistics

Numbers answer one question. Interpretation answers another. Every month I ask myself what the statistics are actually trying to tell us, and in June the answer was straightforward: this was not a month when every Ocean City property suddenly became more valuable. It was a month when the luxury market amplified the headlines while the broader market continued appreciating at a healthy, measured pace.

That distinction is the difference between market noise and market insight. If you own a seven-figure waterfront home, the luxury activity matters to you directly. If you own or are buying a more typical Ocean City condo, the median sale price and price per square foot tell you far more about the market you are actually in. That is why I keep coming back to the median, and why I spend more time studying how buyers behave than simply counting how many homes sold. Behavior usually changes before the statistics do.


What Most People Will Miss In These Numbers

Most market reports stop after publishing the average sale price and total sales volume. Those two numbers had an impressive month, and they also happen to be the most misleading figures in this report.

Here is why. Just six sales accounted for roughly 17% of the entire month's dollar volume. Three came from a single luxury enclave in West Ocean City, and three more came from one oceanfront condominium building. Remove those six transactions and the average sale price falls by more than $70,000, while the median barely moves.

That gap between the average and the median is the whole story of June. The average tells you the top end was busy. The median tells you what a typical Ocean City property actually did, and once again it says the same thing it has said for much of the year: values are rising at a steady, sustainable pace, and well-priced properties are still moving. A surface reading says prices exploded. A careful reading says the luxury market had a loud month while the broader market continued its steady climb. Those are very different conclusions.


June 2026 Market Snapshot

Here is where the Ocean City and West Ocean City housing market stands at the end of June 2026.

Important Note: May 2026 figures below reflect an upward revision from the originally reported 117 sales and $61.3 million in volume to 130 sales and $67.7 million after late-reporting Bright MLS data settled. June's 126 sales are preliminary and may also increase as additional sales are finalized and reported.

Metric June 2026 May 2026 (Rev.) MoM June 2025 YoY
Units Sold 126 130 -3.1% 88 +43.2%
Total Sold Volume $73,378,362 $67,722,000 +8.4% $40,143,892 +82.8%
Median Sold Price $479,500 $447,000 +7.3% $437,500 +9.6%
Average Sold Price $582,368 $520,938 +11.8% $456,181 +27.7%
Avg Price Per Sq Ft $443 $419 +5.7% $414 +7.0%
Median Days On Market 52 42 +10 days 41 +11 days
Average Days On Market 90 77 +17.0% 71 +26.0%
List-To-Sale Ratio 96.7% 98.0% -1.3 pt 97.2% -0.5 pt
Sold At/Above Asking 32 (25%) 43 (33%) n/a 27 (31%) n/a
Sold Below Asking 94 (75%) 87 (67%) n/a 61 (69%) n/a

Source: Bright MLS. Includes Ocean City and West Ocean City closed sales over $50,000.

Month Median Price Trend

Median sold price by month, July 2025 through June 2026. Source: Bright MLS, Ocean City and West Ocean City.

Is the Ocean City market up or down? Up. June 2026 closed 126 sales at a $479,500 median, with price per square foot up 7% year over year. The middle of the market is appreciating steadily.

Here's The Simple Version

The middle of the market kept rising, the top end had a highly visible month, and buyers stayed active but negotiated harder than they did in May. Well-priced properties still sold quickly, while overpriced properties had to work much harder to find the market. The most important takeaway is that the average sale price is not the number to watch this month. The median is.


What The Numbers Tell Us

Price Strength Is Real, And It Is In The Median

The median sold price increased 9.6% year over year while price per square foot increased 7.0%. When those two numbers rise together, it confirms the gain reflects real appreciation rather than a shift toward higher-priced properties selling. The average was distorted by several luxury sales; the median was not. For most Ocean City buyers, sellers, owners, and investors, the median is the cleaner read, and it tells us values are still moving upward, but with more discipline than we saw during the pandemic-era frenzy. That is a healthier kind of strength.

Be Careful With The Year-Over-Year Comparisons

The headline year-over-year figures look enormous, with units up 43.2% and total volume up 82.8%. Those numbers are real, but they need context. June 2025 was one of the softest months in the dataset at just 88 sales, so comparing a strong June 2026 against a weak June 2025 exaggerates the change. The more honest comparison is month over month against a strong May, and on that basis June looks steady rather than explosive. Sales were essentially in line with May's revised 130 closings while the median rose from $447,000 to $479,500. This was a continuation of a healthy spring market, not a sudden new boom.

The Average And Volume Were Skewed By The Top End

Twelve properties closed above $1 million in June, double May's six. A single West Ocean City luxury enclave produced a $3.9 million sale and a $2.2 million sale, and one oceanfront building produced three sales near $1.4 million. Those six transactions alone made up roughly 17% of the month's total volume, which is why the average sale price jumped to $582,368 while the median sat at $479,500. A $103,000 gap between the two is the signature of a top-heavy month. Both stories matter. They just should not be confused.

Inventory And Days On Market Kept Climbing

Median days on market rose from 42 to 52, while average days on market rose to 90, pulled upward by a handful of long-sitting luxury listings, including one that took 488 days to sell. Inventory sits at roughly 4.1 months of supply based on the current sales pace. The pattern is the same one we flagged in May: the market is separating. Well-priced properties are still moving quickly, while overpriced properties sit longer and eventually adjust. That is not a weak market. It is a more selective one, which means opportunity for buyers and a reason for sellers to take pricing seriously.

Buyers Negotiated Harder

Only 25% of June sales closed at or above asking, down from 33% in May, and the list-to-sale ratio slipped to 96.7%. Even the month's top sale closed at roughly 85% of its asking price. Demand is healthy, but discipline is back. Buyers are willing to pay full price for the right property, and we saw several examples of that in June, but they are no longer chasing listings the way they did during the most competitive years of the market. That is a normal market, and normal is not a bad thing.


Ocean City Sub-Market Breakdown

Ocean City is not one single market, and that may be the most important thing to remember when reading any monthly report. Direct oceanfront condos behave differently than bayside waterfront properties, and West Ocean City single-family homes follow a different rhythm than Ocean Block condos. A Midtown condo and a North Ocean City condo can both be Ocean City real estate yet appeal to very different buyers. The sub-market breakdown helps us see where the market moved because of broad demand and where one or two specific sales changed the numbers.

Sales By MLS Location

Location Sales Median Price Avg $/Sq Ft Avg DOM
Direct Oceanfront 24 $540,000 $600 44 days
Oceanfront Indirect View 8 $485,000 $476 209 days
Ocean Block 20 $359,000 $487 81 days
Bayside Interior 27 $304,000 $365 73 days
Bayside Waterfront 29 $492,000 $420 97 days
West Ocean City 18 $737,500 $326 120 days

Direct Oceanfront Led On Speed And Price

With 24 sales at a $540,000 median, Direct Oceanfront moved at the fastest pace in the market at 44 average days. A strong run at Gateway Grand drove much of that activity, with three units closing near $1.4 million at or near full asking price in a matter of days. That is exactly the kind of data point that deserves attention, not because every oceanfront property is surging, but because it shows what happens when pricing, condition, building reputation, and demand all line up.

Bayside Waterfront Produced The Most Volume

Bayside Waterfront was the busiest segment of the month at 29 sales and a $492,000 median, which reinforces how much demand still exists for properties offering water access, views, and boating convenience. The product mix varies widely here, from smaller canal-view condos to larger waterfront townhomes with boat access, so the category resists easy generalization. Still, the volume tells us buyers remain active across the bayside waterfront market.

Bayside Interior Anchored The Entry Point

Bayside Interior recorded 27 sales at a $304,000 median, the most accessible segment in June's market. That matters because affordability has become a bigger part of the conversation. Not everyone entering the market is after direct oceanfront; many buyers want a practical first beach property, a smaller vacation home, or a rental-friendly condo that provides access to Ocean City without stretching into higher price points, and Bayside Interior continues to serve that role.

West Ocean City Carried The Luxury Story

West Ocean City posted 18 sales at a $737,500 median, by far the highest of any segment. Its lower average price per square foot of $326 does not reflect weakness; it reflects product type. This segment is dominated by larger single-family homes, and June included a cluster of seven-figure sales that heavily influenced the numbers. West Ocean City helped drive the luxury headlines, but it did so in a segment that behaves very differently from the condo-heavy island.

A Caution On Small Samples

Oceanfront Indirect View recorded only eight sales, with an average days-on-market of 209 pulled up by one or two long-sitting listings. A single unusual sale can distort a category when the total sample is small, which is exactly why these figures should be read with context rather than turned into a sweeping conclusion about the entire segment.


Street Location Breakdown

Location remains one of the strongest drivers of long-term value, rental demand, and resale performance in Ocean City real estate. Buyers often focus on the building first, and the building certainly matters, but street location still plays a major role in who a property appeals to, how it rents, how it resells, and how it feels to own.

Sales By Street Range

Area Sales Median Price Avg $/Sq Ft
South of 28th Street 15 $507,500 $425
29th to 60th Street 18 $397,500 $525
61st to 90th Street 17 $429,900 $467
91st to 120th Street 28 $415,000 $473
121st Street & North 30 $463,250 $433
West Ocean City 18 $737,500 $326

What This Means

North Ocean City was the busiest stretch of the island in June. The 91st Street and north corridors combined for 58 sales, just over half of on-island activity, and that area often appeals to buyers who want larger floor plans, easier access to North Ocean City amenities, and a more residential beach setting. Midtown carried the highest price per square foot on the island, with the 29th to 60th Street corridor leading at $525 even though its $397,500 median was the lowest on-island figure, a combination that usually reflects a heavier mix of smaller condos rather than softer pricing.

Downtown, south of 28th Street, held a $507,500 median across 15 sales and continues to draw buyers who prioritize Boardwalk proximity and classic Ocean City access. West Ocean City again carried the highest median at $737,500, driven by larger single-family product and June's luxury-heavy mix. The takeaway is a recurring one in Ocean City real estate: price is not just about distance to the ocean. It is also about product type, building mix, walkability, views, and rental demand.


Price Range Analysis

Inventory is growing, but buyer activity is not spread evenly across every price point. Understanding where the sales are happening helps buyers gauge competition and helps sellers understand where their property fits.

Price Range Sales
Under $250K 12
$250K to $399K 38
$400K to $599K 34
$600K to $799K 20
$800K to $999K 10
$1M+ 12

The Story Behind The Numbers

The core of the Ocean City market still lives between $250,000 and $600,000. That band accounted for 72 of June's 126 sales, roughly 57% of the market, and it is where much of the everyday activity happens: second homes, vacation condos, entry-level beach properties, and investment-friendly units.

June was also a month where both ends showed strength. At the entry level, 12 sales closed under $250,000, up from just five in May, and buyers watching that segment should keep an eye on Ocean City properties under $250,000. At the top, 12 sales closed above $1 million, double May's total, which is where the month's luxury listings made their mark. The luxury surge is the obvious headline, but the entry-level activity matters just as much, because it tells us the market is functioning across the full price spectrum rather than only at the top. That is usually a healthier sign than a market where a single segment carries all the activity.


Bedroom Count Analysis

Bedroom count continues to shape pricing, demand, marketability, and rental potential across Ocean City and West Ocean City.

Bedrooms Sales Median Price
Studio 2 $227,500
1 Bedroom 25 $277,000
2 Bedroom 45 $395,000
3 Bedroom 35 $620,000
4+ Bedroom 19 $885,000

Key Takeaways

Two-bedroom properties remain the backbone of the market, with 45 sales and one of the widest buyer pools because they balance usability, rental appeal, and manageable ownership costs. Three-bedroom demand was especially strong in June, with 35 sales at a $620,000 median, reflecting both broader demand for additional living space and several oceanfront luxury units that traded during the month.

At the top, four-bedroom and larger properties remain the scarcest segment and commanded an $885,000 median, lifted by the West Ocean City single-family sales. Larger properties tend to appeal to a different buyer: those wanting more space and long-term ownership, investors pursuing stronger rental capacity, and luxury buyers prioritizing square footage over a single view. The practical read is simple. Smaller units remain important to affordability, two-bedroom properties remain the center of the market, and larger properties are increasingly tied to higher-end ownership and rental strategies.


Notable Sales From June

Several June transactions illustrate where demand was strongest and how differently the top end behaved depending on price, positioning, and buyer perception.

12975 Inlet Isle Ln, West Ocean City - $3,900,000
5BR | Single-Family | 33 Days on Market | Closed at 85% of asking
The month's top sale was also its clearest lesson in high-end pricing. This luxury West Ocean City home found its buyer only after the price came down from a $4.6 million ask. That is not a lack of demand; it is a reminder that even luxury buyers are disciplined when a listing stretches beyond where the market sees value.

12973 Inlet Isle Ln, West Ocean City - $2,199,900
5BR | Single-Family | 5 Days on Market | Closed at 100% of asking
Right next door, the story was completely different. This home was priced correctly, went under contract in five days, and closed at full price. Two neighboring luxury properties, two very different outcomes, one market. That is why pricing strategy matters.

2 48th St #1207 (Gateway Grand), Ocean City - $1,456,000
3BR | Direct Oceanfront | 10 Days on Market | Closed at 100% of asking
One of three Gateway Grand sales this month, this direct oceanfront residence closed at full asking price in just 10 days. Oceanfront demand is very real when the building, pricing, condition, and buyer expectations align.

2 48th St #510 (Gateway Grand), Ocean City - $1,399,000
3BR | Direct Oceanfront | 3 Days on Market | Closed at 100% of asking
Full price in three days. When the right oceanfront unit is priced correctly, it does not need months to find the market. It finds the market immediately.

12351 Meadow Dr, West Ocean City - $1,900,000
5BR | Single-Family | 488 Days on Market | Closed at 89% of asking
This was the patience story of the month. A luxury home sat for well over a year and eventually sold once the price aligned more closely with the market.

Together these sales reinforce the theme running through the entire report. Properties priced to the market move quickly, even at seven figures. Properties priced beyond it may still sell, but the market usually forces a conversation first.


Pending Sales & July Outlook

One of the strongest leading indicators in real estate is what is already under contract. At the end of June, 104 properties were pending or under contract against 517 active listings, new inventory continued entering the market, and showing activity remained healthy. Those are solid signals heading into July, though not a runaway pipeline.

The current pipeline suggests July should produce another healthy month of closings, generally in step with the steady pace we have seen throughout spring and early summer. The larger question is not whether properties will sell, because they will. The better question is at what price. With inventory available and buyers negotiating more aggressively, the properties that close quickly will likely be the ones priced closest to the most recent comparable sales. As always, we will know more once the numbers finalize, and you can always compare against the May 2026 report to see how the trend is developing.

Will July be strong in Ocean City? The indicators point to a steady month. At the end of June, 104 properties were pending or under contract against 517 active listings.


Cash Buyers Continue To Shape The Market

About 41% of June buyers paid cash, up from May's 32% and above the roughly 30% to 37% range we have seen over the past year. The reason is fairly straightforward: June was a luxury-heavy month, and high-end buyers, particularly in the seven-figure West Ocean City and oceanfront segments, skew heavily toward cash.

That matters because cash buyers shape how this market behaves. They create faster transactions, reduce financing risk, strengthen negotiating positions, and often give sellers greater certainty. Ocean City has always drawn a higher share of cash buyers than many traditional residential markets, because second-home ownership, retirement, investment, and 1031-style reinvestment are all common here. For sellers, understanding the cash-buyer dynamic remains an important part of pricing and negotiation strategy. For buyers using financing, preparation matters just as much; a financed buyer can absolutely compete, but they need a strong pre-approval, a lender who understands resort condos and their monthly fees, and a clear strategy before making an offer.

What percent of Ocean City buyers pay cash? In June 2026, about 41%, higher than usual because of a luxury-heavy month. The typical range runs closer to 30% to 37%.


What This Means For Buyers Right Now

If you are buying in Ocean City or West Ocean City right now, this remains one of the healthier market environments we have seen in several years. That does not mean prices are falling, because they are not; the median rose again in June and price per square foot moved higher. But buyers now have something they rarely had during the most competitive years: choice. Inventory is deeper, days on market are longer, sellers are listening more carefully to feedback, and June proved that buyers are negotiating with more confidence than they did even a month ago.

Only 25% of June sales closed at or above asking, which means three out of four sold below asking. In a market where values are still rising, that is meaningful negotiating leverage. But leverage is not the same as weakness. The best properties still move quickly, as we saw at Gateway Grand and on Inlet Isle Lane, so the opportunity right now is not throwing low offers at great listings and hoping something sticks. The opportunity is disciplined buying: look for properties sitting longer than the strongest recent comparables, for sellers who started too high and may now be ready to listen, and for good properties that need a pricing conversation rather than bad properties that simply look cheap.

If I were buying today, I would ignore the loudest headlines and focus on the listings that have sat for three to eight weeks without meaningful activity, because that is often where the best conversations begin. I would not expect a major discount on a well-priced oceanfront property that just hit the market, but I would study the listings that missed their first wave of buyer attention, especially those with good bones, a strong location, and a seller who appears ready to respond to market reality. Deciding whether the timing is right for you is its own question, and our take on whether buying here makes financial sense is a good place to start. The best buyer opportunity is rarely the cheapest listing; it is the one where the seller's expectations and the market's opinion are finally starting to meet.


What This Means For Sellers Right Now

For sellers, June sent one clear message: price to the market or prepare to wait. That does not mean sellers have lost control, because values are still rising, buyers are still active, and good properties continue to command strong results. But the margin for overpricing has narrowed. Pricing, condition, presentation, marketing, and responsiveness to feedback all matter more than they did a year ago.

The proof is inside June's own sales. A correctly priced West Ocean City home sold in five days at full price, the luxury home next door started too high and closed at roughly 85% of asking, and another West Ocean City property sat 488 days before finally selling once the price met the market. Same general market, different pricing stories, very different outcomes. The market is still rewarding strong properties that are priced well, presented professionally, and adjusted quickly when feedback points in a clear direction. What it is no longer rewarding is optimism unsupported by current comparable sales.

If I were selling today, I would spend less time asking what the highest number we can justify is, and more time asking what price creates the strongest buyer response in the first two weeks, because that first wave of attention still matters. The goal is not to underprice; it is to position the property where the best buyers immediately understand the value, and in a market with more inventory the right price is as much a marketing strategy as it is a number. I would also be honest about condition, because buyers have choices now and the cleaner, better-presented, better-marketed property usually wins. A current valuation, a look at how to prepare a condo for sale, and an honest review of the most common seller mistakes are the right starting points.


Frequently Asked Questions

Is Ocean City Currently A Buyer's Market Or Seller's Market?

Ocean City is in a balanced market. Inventory has grown to roughly four months of supply, giving buyers real choice and more negotiating room than they had during the most competitive years, while steady price appreciation and healthy demand continue to support sellers who price correctly.

Are Ocean City Condo Prices Still Rising?

Yes. The median sold price rose 9.6% year over year in June 2026, and average price per square foot rose 7.0%. When those two numbers move together, it confirms that appreciation is genuine rather than the result of more expensive properties happening to sell.

Why Did June's Average Sale Price Jump So Much?

A small number of luxury transactions pulled the average higher. A $3.9 million West Ocean City home, a $2.2 million West Ocean City sale, and three oceanfront units near $1.4 million all had a meaningful impact. The median, at $479,500, is the more reliable measure of a typical Ocean City sale.

Why Does Grant Focus On The Median Instead Of The Average?

In a resort market like Ocean City, the average can be heavily influenced by a few exceptional luxury sales, while the median gives a cleaner read on the center of the market. The average tells us what happened when the most expensive sales are included; the median tells us where the market's center of gravity actually sits.

Why Do Your Market Reports Sometimes Differ From National Real Estate Websites?

National websites often rely on broad automated datasets, countywide figures, estimated values, or delayed public records. This report is based on closed Bright MLS sales in specific Ocean City and West Ocean City MLS areas, paired with firsthand interpretation from active local agents. That difference matters because Ocean City is a resort market with many micro-markets that can each behave differently in the same month.

Is Now A Good Time To Buy In Ocean City?

For many buyers, yes. Inventory is higher, competition is more manageable than during the pandemic-era market, and three out of four June sales closed below asking, which gives buyers meaningful leverage in a market with a long history of appreciation. The key is to buy with discipline, because strong properties still move quickly.

Are Cash Buyers Still Important In Ocean City?

Very. About 41% of June buyers paid cash, elevated by a luxury-heavy month compared with a more typical range of 30% to 37%. Cash remains a defining feature of the market because second-home ownership, retirement, investment, and reinvestment buyers are all common here.

What Types Of Properties Are Selling Fastest?

Properties priced to recent comparable sales, in strong condition, in desirable locations, and supported by good amenities or views. Several June sales closed in under a week, including properties above $1 million. The common thread was not price point; it was alignment between pricing, presentation, and buyer expectations.


Three Things I'll Be Watching Next Month

Every monthly report answers one set of questions and creates another. Heading into July, three stand out.

The first is whether luxury momentum continues. June's high-end activity was meaningful, but one strong month does not make a trend, so I will be watching whether seven-figure sales continue at this pace or whether June proves to be an unusually strong luxury month driven by a concentrated group of transactions.

The second is whether median appreciation holds as inventory grows. Inventory is giving buyers more options, but so far that has not stopped median prices from rising. If the median keeps climbing while inventory stays healthy, that would reinforce the strength of the broader market.

The third is whether buyers keep negotiating harder. Only 25% of June sales closed at or above asking, and if that number stays low or moves lower, it will tell us buyers are continuing to gain leverage even as prices remain strong. A market can appreciate and become more negotiable at the same time, and June showed us exactly that.


Grant's Market Compass

A quick read on what strengthened, held steady, and softened in June.

Strengthening

Median sold price, price per square foot, luxury activity, cash-buyer share, Direct Oceanfront demand, and West Ocean City luxury activity.

Holding Steady

Overall transaction pace, buyer demand, core activity between $250,000 and $600,000, two-bedroom condo demand, and long-term Ocean City ownership appeal.

Softening

List-to-sale ratio, seller leverage on overpriced listings, the share of homes selling at or above asking, and buyer urgency on properties that miss the mark.

The compass is not pointing toward weakness. It is pointing toward discipline, and that is a very different thing.


Market Outlook

Heading into the heart of summer, the Ocean City real estate market looks like something buyers and sellers have not seen in several years: normal. Inventory is available, buyers have choices, sellers still have real opportunities when they price to the market, and prices continue rising at a sustainable pace grounded in the median rather than the headlines.

That is the part of June I find most encouraging. The market is not being carried only by fear, urgency, or a lack of inventory. It is supported by real demand, realistic negotiations, and a buyer pool that still values Ocean City ownership. The thing I will watch most closely in July is whether the top end stays this active or settles back toward its typical pace, and whether median appreciation holds as inventory builds. So far, demand is holding up well. The market is disciplined, not weak, and a disciplined market is usually a more stable one.


Why You Can Trust This Report

Unlike reports that rely solely on automated national datasets, this one combines Bright MLS sales data with active market participation: buyer and seller consultations, showing activity, inventory analysis, contract activity, pricing conversations, and nearly three decades of firsthand Ocean City real estate experience.

The goal is simple. Help buyers, sellers, investors, and owners understand what is actually happening in the Ocean City real estate market, without sensational headlines or overly broad national assumptions. Ocean City is a resort market, a condo market, an investment market, a second-home market, and a lifestyle market all at once, and those layers matter. Reading the numbers correctly requires more than pulling statistics from a database. It requires understanding how buyers think, how sellers respond, how buildings differ, and how individual micro-markets behave from one month to the next. That is the perspective this report is designed to provide.

About The Author

Grant Fritschle is a second-generation Ocean City Realtor and co-founder of The Fritschle Barker Group at Keller Williams Realty of Delmarva. With nearly 30 years of experience and more than 2,000 personal transactions, Grant specializes in oceanfront condominiums, waterfront homes, investment properties, vacation homes, luxury real estate, and resort market analysis.

Grant is also co-owner of Central Reservations, one of Ocean City's largest vacation rental management companies, giving him a rare view of both property ownership and rental performance.

Data Source: Bright MLS. Statistics reflect closed sales reported through June 30, 2026 for Ocean City and West Ocean City MLS areas 80 through 85, over $50,000. June figures are preliminary and may be revised upward as additional sales are reported.

Trust Source Disclosure: This report was researched, written, reviewed, and interpreted by real members of The Fritschle Barker Group. Artificial intelligence tools may be used for editing, formatting, and readability. All market analysis, observations, and opinions reflect local expertise, MLS data, and firsthand experience serving Ocean City and Delaware beach real estate clients.

Best Realtors in Ocean City MD

Your Top Ocean City, MD Real Estate Agents

Today, they are recognized nationally as a top-performing group of charismatic, skilled Agents deeply connected to the vibrant towns of the Eastern Shore. More than agents, they are trusted advisors and community advocates, blending local knowledge with national strategy to deliver exceptional results.

The Fritschle Barker Group at Keller Williams Realty of Delmarva adheres to all Fair Housing Act guidelines and NAR ethical standards.

June 26, 2026

How to Read an Ocean City Condo Reserve Study & Budget

How to read an Ocean City MD condo reserve study and budget

How to Read an Ocean City Condo Reserve Study and Budget (2026 Buyer's Guide)

Quick Answer

Before buying an Ocean City condo, review three documents together: the reserve study, the current operating budget, and the most recent board meeting minutes. Compare the reserve study's recommended annual reserve contribution to what the association is actually budgeting, confirm the building is appropriately funded, and look for major projects scheduled during your expected ownership period. In 2026, these same documents do more than predict future expenses. They can also determine whether the building qualifies for conventional financing.

Key Takeaways

  • Never review the reserve study by itself.
  • Always compare the reserve study to the annual budget.
  • Pay close attention to the building's percent funded.
  • Low condo fees are not always a bargain.
  • Meeting minutes often reveal problems before they appear in financial statements.
  • New 2026 lending standards make reserve funding more important than ever.
  • A financially healthy building protects both your investment and your future resale value.

Before You Fall in Love With the View

Imagine this. You have finally found the perfect Ocean City condo.

The balcony overlooks the ocean. The kitchen has already been renovated. The building is exactly where you wanted to be.

You picture family vacations, rental income, and morning coffee watching the sunrise. Everything feels right.

Then, six months after closing, a letter arrives. The association needs to replace the roof, the elevators need modernization, and the reserve account is not large enough. The letter tells you that you are responsible for a $23,800 special assessment, and they need that money within the next few months.

Here is the problem. Nobody lied to you. Nobody hid the documents. They were sitting in the resale package the entire time.

The problem is that very few buyers know how to read them.

After nearly 30 years helping buyers purchase Ocean City condominiums, I have learned something that is surprisingly consistent. Most buyers spend more time comparing kitchen countertops than they do evaluating the financial health of the building they are about to join.

That is backwards. Countertops are cosmetic. Building finances affect your ownership costs, your financing options, your future resale value, and even whether you receive a surprise special assessment after closing.

The good news is that learning what matters is not nearly as complicated as most buyers think.

In this guide, I will show you exactly how I review condominium documents before recommending a building to one of my clients.

At a Glance

If you are short on time, here are the five things I check first.

  • Reserve study date
  • Percent funded
  • Recommended reserve contribution
  • Current budget contribution
  • Recent meeting minutes

Those five items tell me more about a building than almost anything else.

The Three Documents That Protect Your Money

One of the biggest misconceptions buyers have is believing the reserve study tells the entire story.

It does not. The reserve study tells you what should happen. The budget tells you what the association is actually doing. The meeting minutes tell you what the board is worried about.

Each document answers a different question. Together, they tell the complete financial story.

When buyers go under contract in Maryland, they receive an opportunity to review the condominium documents before becoming fully committed. Many buyers spend most of that review period reading pet policies, rental restrictions, parking rules, and architectural guidelines.

Those are certainly important. But the documents that protect your financial future are usually much less exciting. They are the financial documents.

After reviewing hundreds of Ocean City condominium packages over the years, my review process is almost always the same. I start with three documents:

  1. The reserve study
  2. The current operating budget
  3. The most recent meeting minutes

Everything else builds from there. If you want the broader view of how these documents fit into choosing a building, see my guide on how to choose the right Ocean City condo building.

Grant's Bottom Line

The reserve study tells me what the building should be saving. The budget tells me whether it actually is. The meeting minutes tell me whether the board knows something the financial statements do not. That is why I never evaluate one document without the other two.

What This Means For You

A beautiful condo inside a financially unhealthy building can quickly become one of the most expensive purchases you will ever make. A building with slightly higher monthly fees but strong financial planning is often the safer long-term investment.

What a Reserve Study Actually Is

Quick Answer: A reserve study is a professional long-term financial plan that estimates when a condominium's major shared components will need repair or replacement, what those projects will cost, and how much money the association should save each year to prepare for them.

Think of it as the building's financial roadmap.

A professional engineering or reserve study firm evaluates major common elements such as:

  • Roofs
  • Elevators
  • Parking garages
  • Pools
  • Balconies
  • Bulkheads
  • HVAC systems serving common areas
  • Exterior finishes
  • Mechanical equipment

The study estimates remaining useful life, future replacement cost, and recommended annual reserve contributions. That information becomes the blueprint for the association's long-term financial planning.

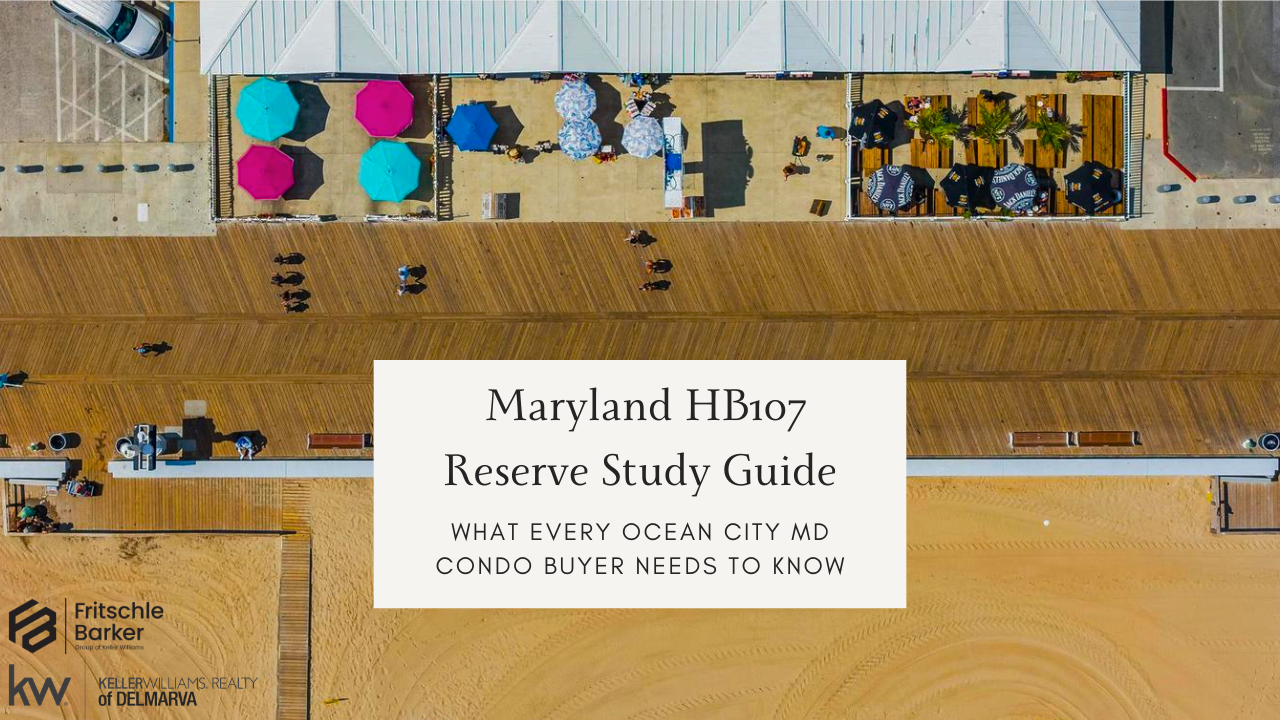
Thanks to Maryland House Bill 107, condominium associations throughout Maryland are now required to regularly update reserve studies and more carefully evaluate reserve funding. For a full breakdown of that law and what it requires, see my Maryland HB107 reserve study guide.

For buyers, that is good news. The information is usually available. The challenge is understanding what it means.

Expert Insight

Ocean City buildings often face maintenance challenges that inland condominiums never encounter. Salt air, ocean winds, and constant moisture mean these buildings simply experience more wear than many inland communities. That is one reason reserve studies matter so much here.

Common Buyer Mistake

Many buyers believe the reserve study predicts special assessments. That is not true. It predicts future maintenance. Special assessments usually happen when associations fail to follow the reserve study's funding recommendations. That is a very different issue.

What This Means For You

Do not ask whether a reserve study exists. Ask whether the association is actually following it. Those are two very different questions.

How to Read a Reserve Study Summary

The good news is that you probably do not need to read all 70 pages.

Most reserve studies begin with an executive summary. That is where I spend most of my time initially. Three numbers usually tell me almost everything I need to know.

1. Percent Funded

This compares the money the association has actually accumulated against what the reserve study estimates should already be available.

Generally speaking:

  • Above 70 percent funded indicates strong reserve health.
  • Between roughly 30 percent and 70 percent deserves closer review.
  • Below 30 percent raises meaningful questions that require additional investigation.

No single percentage automatically determines whether a building is a good or bad purchase. But it absolutely tells me where I need to dig deeper.

2. Recommended Annual Contribution

Next, I locate the annual reserve contribution recommended by the reserve study. Write this number down. You are going to compare it to the current operating budget in the next section. That comparison is one of the most valuable financial checks any condo buyer can perform.

3. Major Components Coming Due

Finally, I scan the schedule for major projects expected during the next five years. Why five years? Because that is roughly the ownership horizon for many buyers.

If the study shows roof replacement, elevator modernization, balcony restoration, or garage repairs scheduled within your likely ownership period, I immediately compare those projects against available reserve funding.

Grant's Bottom Line

If I only had two minutes to evaluate a reserve study, I would check percent funded, the annual contribution recommendation, and major projects due within five years. Those three items often tell me whether a building deserves deeper investigation.

Common Buyer Mistake

Many buyers stop reading once they find a recent reserve study. The date matters. But what matters even more is whether the association is actually funding the recommendations inside it. A recent reserve study with ignored recommendations is not nearly as valuable as buyers often assume.

What This Means For You

The reserve study does not just tell you about the building. It tells you how responsibly the association has been planning for your future ownership experience.

How to Read the Budget

If the reserve study is the plan, the operating budget is the proof of whether the plan is being followed.

When I read a condominium budget, I am not trying to audit every line item. I am looking for one thing first: how much the association is setting aside for reserves each year, and how that figure compares to what the reserve study recommended.

A useful reference point: Fannie Mae and Freddie Mac generally expect a condominium association to direct at least 10 percent of its annual operating budget to reserves for the building to remain eligible for conventional financing. A building budgeting well below that line is not only saving too little. It may also be creating financing problems for future buyers, which can affect your own resale down the road.

That single comparison leads directly into the most useful check I run on any building.

The Contribution Gap

Quick Answer: One of the fastest ways to evaluate a condominium's financial health is to compare what the reserve study recommends saving each year against what the association is actually budgeting. I call this the Contribution Gap.

After reviewing hundreds of Ocean City condominium document packages, I have found there is one comparison that often tells me more than any other. It is incredibly simple.

Take the reserve study's recommended annual reserve contribution, and compare it to the amount the association actually budgets for reserves each year. That is it. I call the difference the Contribution Gap.

If those two numbers are reasonably close, that is generally a positive sign. If the reserve study recommends contributing $180,000 each year but the association is only budgeting $90,000, I immediately want to understand why.

Sometimes there is a perfectly reasonable explanation. Sometimes there is not. The key is asking the question before you become an owner.

A Side-by-Side Example

To show how this works in practice, here are two illustrative buildings with comparable operating budgets. The numbers are simplified examples, not any specific Ocean City building.

Indicator Association A Association B
Percent funded 78 percent (strong) 24 percent (weak)
Reserve study recommends per year $235,000 $180,000
Association actually budgets $225,000 $90,000
The Contribution Gap $10,000 $90,000
Reserves as share of annual budget 20 percent 8 percent

Association A is doing what it should. It is well funded, and its budget closely follows the reserve study. The small gap is normal.

Association B looks very different. It is significantly underfunded, it is budgeting only half of what its own reserve study recommends, and it is directing just 8 percent of its annual budget to reserves. That last figure falls below the 10 percent level that conventional lenders generally expect, so Association B's underfunding is not just a savings problem. It can affect whether future buyers qualify for a conventional loan, which puts downward pressure on resale demand.

Two buildings. Two very different financial futures. The Contribution Gap is what makes the difference visible.

Grant's Bottom Line

A reserve study is only valuable if the association follows it. The Contribution Gap reveals whether the board is planning ahead or simply pushing today's expenses onto tomorrow's owners.

Common Buyer Mistake

Low monthly condo fees often feel like a bargain. Sometimes they are. Sometimes they are simply the result of underfunding reserves. The least expensive monthly fee can become the most expensive ownership decision. For a deeper look at what condo fees actually pay for, see my guide on Ocean City condo fees explained.

What This Means For You

Do not compare condo fees between buildings without also comparing reserve funding. Higher fees occasionally reflect stronger financial planning, not poor management.

Healthy Buildings vs. Underfunded Buildings

Not every building with lower reserves should be avoided. Likewise, not every building with strong reserves is automatically a great purchase. Context matters. Here is how I generally think about it.

Healthy Building Building That Deserves Closer Review
Reserve study updated regularly Reserve study significantly outdated
Reserve contributions generally align with recommendations Large Contribution Gap
Board discusses long-term planning Board repeatedly delays projects
Major repairs planned proactively Emergency repairs dominate discussions
Healthy reserve balance Heavy dependence on special assessments

This is not a pass or fail test. It is a starting point for asking better questions.

Expert Insight

Some of the healthiest associations I have reviewed were not the ones with the lowest condo fees. They were the ones that consistently made disciplined financial decisions year after year. Strong buildings rarely become strong by accident.

What Meeting Minutes Reveal

Quick Answer: Meeting minutes often reveal issues months or even years before they affect owners financially. They are frequently the most overlooked document in the resale package.

Reserve studies explain what should happen. Budgets explain what is funded. Meeting minutes explain what is actually happening.

When I review meeting minutes, I am looking for patterns. For example:

  • Are the same repairs discussed repeatedly?
  • Are projects continually postponed?
  • Are contractors struggling to complete work?
  • Are insurance issues becoming more frequent?
  • Are owners expressing concern about maintenance?

One discussion is not necessarily a problem. Repeated discussions without meaningful progress deserve attention.

Grant's Bottom Line

Healthy associations do not avoid difficult conversations. They address them. Meeting minutes that openly discuss upcoming repairs usually give me more confidence than minutes that never mention maintenance at all.

Common Buyer Mistake

Many buyers assume meeting minutes only contain administrative details. In reality, they are often the earliest warning sign of future financial obligations.

What This Means For You

Do not just skim the meeting minutes. Read them looking for trends, not isolated comments.

Why 2026 Matters More Than Ever

The importance of reserve funding has grown significantly, and 2026 is the reason.

Maryland House Bill 107 has increased reserve study requirements for condominium associations. At the same time, the March 18, 2026 Fannie Mae and Freddie Mac updated lending standards placed greater emphasis on reserve funding, deferred maintenance, structural integrity, and financial transparency when deciding whether a condominium project is eligible for conventional financing.

For buyers, this means condominium finances now affect much more than monthly fees. They may also influence:

  • Financing eligibility
  • Appraisal outcomes
  • Future buyer demand
  • Long-term resale value

Financially healthy associations generally create more financing opportunities for future buyers. That benefits today's owners as well.

The most concrete change: the minimum reserve funding lenders look for is rising from 10 percent to 15 percent of budgeted assessment income for loan applications dated on or after January 4, 2027, unless the association has a recent reserve study and funds at its highest recommended level.

Quick Reality Check

Reserve studies are no longer just accounting documents. They are increasingly becoming lending documents.

Warrantable vs. Non-Warrantable Condominiums

Quick Answer: A warrantable condominium generally meets conventional lending guidelines established by Fannie Mae and Freddie Mac. A non-warrantable condominium may require alternative financing options.

Buyers do not always discover financing issues until they are already under contract. That is why this conversation matters early.

Factors that may affect warrantability include:

  • Reserve funding
  • Structural concerns
  • Commercial space ratios
  • Insurance coverage
  • Litigation
  • Owner occupancy levels
  • Deferred maintenance

This does not automatically make a non-warrantable building a bad investment. It simply changes the financing conversation.

What This Means For You

If you are financing your purchase, understanding warrantability before writing an offer can save time, money, and frustration.

If This Were My Money

People often ask me what I would look at first.

Honestly? I would not start with the kitchen. Or the flooring. Or even the view. I would start with the building.

If this were my money, I would answer four questions before writing an offer:

  1. Is the reserve study current?
  2. Does the budget reasonably follow its recommendations?
  3. Do the meeting minutes suggest proactive management?
  4. Does the building appear financially stable enough that I would feel comfortable owning there for years?

Only after those questions are answered would I begin comparing finishes and upgrades. Beautiful units can be renovated. Building finances are much harder to change.

Grant's Two-Minute Building Review

If someone handed me a condominium resale package and gave me only two minutes to decide whether the building deserved deeper investigation, here is exactly where I would start.

  • Reserve study completed recently
  • Reserve contribution aligns with recommendations
  • Healthy percent funded
  • Major projects identified and planned
  • Meeting minutes show proactive planning

If those five areas look solid, I keep digging. If multiple concerns appear immediately, I slow down and ask more questions before moving forward.

What to Ask Before Writing an Offer

Before writing an offer, ask yourself:

  • Have I reviewed the reserve study?
  • Have I compared the reserve recommendation with the current budget?
  • Have I reviewed recent meeting minutes?
  • Do I understand upcoming capital projects?
  • Have I discussed warrantability with my lender?
  • Has my Realtor reviewed these documents with me?

If several answers are no, you are probably making one of the largest financial decisions of your life without all the information you deserve.

Frequently Asked Questions

What is the most important number in a reserve study?

There is not a single number that tells the entire story, but I usually begin with percent funded and then compare the recommended reserve contribution to the association's actual budget.

What percent funded is considered healthy for a condo building?

As a general industry guideline, above 70 percent funded is considered strong, 30 to 70 percent is fair and deserves closer review, and below 30 percent is weak and carries a higher risk of special assessments.

Can condominium finances affect my mortgage?

Yes. Since the March 18, 2026 Fannie Mae and Freddie Mac updates, reserve funding, deferred maintenance, and structural condition can all affect whether a building is eligible for conventional financing. Underfunded buildings can be harder to finance.

Can a healthy reserve study increase resale value?

Indirectly, yes. Financially healthy buildings often attract more buyers, qualify for a broader range of financing options, reduce the likelihood of unexpected assessments, and create greater confidence during resale.

Should I worry about low condo fees?

Not automatically. Sometimes low fees reflect efficient management. Other times they indicate underfunded reserves. Always compare fees with reserve funding before drawing conclusions.

How often should reserve studies be updated?

Maryland law establishes reserve study requirements for condominium associations. Buyers should confirm that the study they are reviewing is current and reflects the building's present condition.

Can I review these documents before making an offer?

Sometimes. In many cases the full resale package is delivered after contract ratification, although some associations or sellers may voluntarily provide documents earlier. Your Realtor can often help determine what information is available before you write an offer.

Do these rules apply to every Ocean City condominium?

The principles apply broadly, but every association is different. Financial strength should always be evaluated based on the specific building rather than assumptions about the market as a whole.

Why You Can Trust This Guide

This guide was written from the perspective of someone who has spent nearly three decades helping buyers evaluate Ocean City condominiums.

Grant Fritschle is a second-generation Ocean City Realtor, co-founder of The Fritschle Barker Group, and co-owner of Central Reservations, one of the area's longest-running vacation rental management companies. Over the course of more than 2,000 transactions, Grant has reviewed hundreds of condominium resale packages, reserve studies, budgets, and meeting minutes across Ocean City and the Delaware beaches.

One recent buyer, Steve M., said Grant "used his years of local experience to guide us to a great condo in a financially sound and well managed building."

The observations in this article are grounded in:

  • Bright MLS experience
  • Real condominium transactions
  • Ocean City building knowledge
  • Maryland condominium requirements
  • Ongoing buyer consultations
  • Practical ownership experience

The purpose is not to replace legal, engineering, accounting, or lending advice. It is to help buyers ask better questions before making one of the largest financial decisions of their lives.

About the Author: Grant Fritschle is a second-generation Ocean City Realtor and co-founder of The Fritschle Barker Group at Keller Williams Realty of Delmarva. With nearly 30 years of experience and more than 2,000 personal transactions, Grant specializes in Ocean City condominiums, waterfront homes, luxury properties, vacation homes, and investment real estate. Reach Grant directly at 410-430-5880 or the office at 410-524-6400.

Best Realtors in Ocean City MD

Your Top Ocean City, MD Real Estate Agents

Today, they are recognized nationally as a top-performing group of charismatic, skilled Agents deeply connected to the vibrant towns of the Eastern Shore. More than agents, they are trusted advisors and community advocates, blending local knowledge with national strategy to deliver exceptional results.

The Fritschle Barker Group at Keller Williams Realty of Delmarva adheres to all Fair Housing Act guidelines and NAR ethical standards.

June 12, 2026

Best Real Estate Agents in Ocean City MD: How to Choose the Right Realtor

How to choose the right real estate agent in Ocean City MD

Best Real Estate Agents in Ocean City MD: How to Choose the Right Realtor

There is no single best real estate agent in Ocean City, and any page that tells you otherwise is probably selling you something. This guide explains what to look for, gives you the questions to ask, and names five other respected Ocean City agents worth your consideration.

Quick Answer

There is no single best real estate agent in Ocean City, and any page that tells you otherwise is probably selling you something.

There is a way to tell a good one from a bad one inside about twenty minutes, and it has almost nothing to do with awards, billboards, or how many yard signs you have seen.

Here is the test, and it comes straight from how Grant Fritschle runs a listing appointment: if the conversation was mostly about the agent, it was not a good interview. A good one is mostly about you. Your goals, your timeline, your reasons for buying or selling, and what you actually need this property to do.

This guide explains what to look for, gives you the questions to ask, and names five other respected Ocean City agents worth your consideration.

Key Takeaways

  • There is no single best Realtor for everyone. There is a best fit for your situation.
  • A good listing or buying interview is mostly about you. If it is mostly about the agent, that is a signal.
  • Setting your price is your decision. The agent's job is to bring you the data, explain the range, and then execute the strategy you choose.
  • Ocean City runs on buildings, not neighborhoods. Two condos across the street from each other can behave completely differently.
  • Timing and pricing are linked. An agent who never raises timing with you has skipped half the conversation.
  • Commission is negotiable and set by agreement. Any agent should be able to explain what their fee covers without implying there is a standard rate.
  • Interview more than one agent. Good agents welcome it.

Every Realtor Claims To Be The Best

Every Realtor in Ocean City MD claims to be the best

Including us.

Let us get that out of the way.

Search "best Realtor in Ocean City MD" and you will find page after page making the identical claim. Top producer. Award winner. Local expert. Number one. Five stars.

The problem is not that every claim is false. Some of them may be perfectly true. The problem is that they are usually not very useful to you.

The best agent for a first-time condo buyer is often not the same agent you would choose to sell a waterfront home. The best agent for an investor may not be the best agent for someone buying a second home they never intend to rent. The best agent for a complex estate sale may not be the best agent for a fast-moving beach condo purchase.

What you are actually looking for is the best fit, for you, for this transaction.

So rather than spend this page telling you we are the best, we are going to show you how to evaluate any agent in this market, including us. At the end, we name five other Ocean City agents we respect.

Use all of it.


What Defines The Best Real Estate Agents In Ocean City MD?

What defines a good real estate agent in Ocean City MD

Short answer: the best Ocean City agents ask more than they tell, hand you the data instead of just a number, raise timing before you do, understand building-level risk, and are willing to say when they are not the right fit.

Five things separate a good agent here from an average one. None of them are visible from the outside, which is why we are giving you the questions instead of just the conclusions.

1. The Interview Is Mostly About You

This is the clearest signal available to you, and you can read it in the first ten minutes.

Grant puts it plainly:

"My biggest thing is, as Realtors in an interview, it shouldn't be all about us. It should be all about the seller. And if that conversation and that interview feels like it was 70 percent of discussion about the Realtor, I don't know that it was a successful interview."

The reason is not modesty. It is strategy.

In Ocean City, every seller is selling for a different reason, and those reasons change the entire plan.

Somebody selling because they have stopped using the property has a different timeline than somebody selling to settle an estate. If that is your situation, we wrote a full guide to selling an inherited property in Ocean City . That person has a different timeline than someone selling one unit to buy a larger one in the same building. And that person has a different set of concerns than a seller trying to unwind a rental-heavy property with future bookings already on the calendar. Price, marketing, showing schedule, rental-calendar handling, repair decisions, and negotiating posture all move depending on your reason for selling.

An agent who spends the appointment on their own credentials has not gathered any of that.

They cannot have, because they were talking.

2. They Give You The Data, Not Just A Suggested Price

This is the mistake that costs sellers the most money, and it is almost always misunderstood.

Grant's view:

"It is not my job. It is not the other Realtor's job ... It is not our jobs to give you price. It is our job to give you all the information. All the data, all the market reports, and to give you a price range of what the data says and the market says. And then to have a conversation with you, the seller, about what price you would like to try, and what that means. And it is the seller's decision. It's my job to go execute."

Here is why this matters in practice.

Sellers routinely choose the agent who quoted the highest number. That number is not a promise. It is not binding. And the agent who gave it to you has no obligation to deliver it.

What you may have actually done is select for optimism.

The agent's real job is to show you the comparable sales, explain what the current market is doing, give you a supportable range, and then tell you honestly what happens at each price you might choose. What happens if you price at the top of the range? What happens if you price above it? What does that do to showing activity? What does it do to time on market? What does it do to negotiation leverage thirty days later?

The decision stays yours. The execution is theirs.

If an agent leads with a number before they have shown you the data behind it, ask to see the data.

3. They Ask About Timing Expectations And Goals Before You Do

Grant points out something in the listing interview that should bother sellers more than it probably does:

"I'm absolutely amazed when I go talk to a seller, and they've interviewed other agents. How rarely anybody discusses timing with them. I mean, basic economics, price and pace are tied together."

Price and time are the same conversation.

A property priced above the market can still sell, eventually, but time on market becomes part of the story. Buyers see it. Agents see it. Showing activity changes. The offer conversation changes. The market starts asking what is wrong, even when nothing is wrong except the original price.

That is why timing matters.

If a seller needs to sell quickly, one pricing strategy makes sense. If a seller has no urgency and is comfortable testing the market, a different strategy may be reasonable. If the property is a summer rental with bookings, the calendar matters. If the property is part of an estate, timing and certainty may matter more than squeezing for the last dollar.

An agent who talks about price and never about pace has given you half an answer.

4. They Understand Ocean City Buildings, Not Just Ocean City

A general Ocean City answer is not enough.

You need building-level knowledge.

That means knowing which buildings have strong rental histories, which buildings have had assessment issues, which buildings have complicated insurance reviews, which buildings are well-run, which buildings have fees that look low for the wrong reasons, and which buildings have quirks that may not show up until you are already under contract.

This is especially important for condos because condo ownership is not just the unit. It is the building, the association, the budget, the reserve position, the insurance structure, the rental rules, and the long-term maintenance story.

A good Ocean City agent does not just ask, "Do you like the unit?"

They ask, "Do you understand the building?"

5. They Will Tell You When They Are Not The Right Fit

Grant's position is simple:

"If I don't think I'm gonna be the right fit, if I don't think I'm gonna be able to help you, I'm gonna tell you."

Every agent will tell you they put clients first.

Ask them for an example of a listing or client they turned away, and why.

The answer is more informative than the promise.


Why Ocean City Real Estate Is Different

Why the Ocean City MD real estate market is different from most markets

Short answer: Ocean City combines lifestyle buying, investment expectations, and genuine scarcity. The result is a market that rewards building-level knowledge over general real estate experience.

Three forces overlap here, and they do not overlap in most markets.

Lifestyle

Many buyers are purchasing something they have wanted for twenty years.

That is not a criticism. It is a fact that changes how decisions get made.

People do not always buy beach property with the same mindset they use to buy a primary residence. They buy memories, flexibility, views, access, family time, and a version of their life they want more of.

A good agent respects that without letting emotion outrun the facts.

Investment

Many of those same buyers also expect the property to produce income, offset costs, or appreciate. Sometimes all three.

That may be reasonable. It may not be.

Rental income, carrying costs, condo fees, taxes, insurance, special assessments, repairs, financing, and personal-use expectations all need to be discussed honestly.

A property can be a wonderful second home and a mediocre investment. A property can be a strong rental and not feel like the right personal-use fit. The best agent helps you understand the tradeoff before you buy.

Scarcity

There is a fixed amount of oceanfront and waterfront, and no more is being created.

That does not mean every property is worth any price. It does mean the best-located and best-run properties tend to hold attention, especially when the right inventory is limited.

Scarcity matters, but it is not a substitute for analysis.

Condos Dominate, And Condos Are Documents

Ocean City's inventory is heavily condominium-driven.

That means a large part of what you are buying is paperwork.

The unit matters, of course. So do the view, the condition, the building, the amenities, and the location. But the condo documents often tell you what the listing cannot:

  • The association budget and what the condo fee actually covers
  • The reserve study and reserve funding position
  • Rental restrictions and rental history
  • Assessment history and any assessment currently contemplated
  • Insurance structure, including what the master policy does and does not cover
  • Rules on pets, parking, storage, amenities, and building use
  • Owner occupancy and rental concentration where relevant to financing

An agent who cannot walk you through those documents is not fully able to tell you what you are buying.

Single-Family Is A Different Market Entirely

This is worth repeating because buyers routinely assume the single-family and condo markets behave the same way. They do not.

It is a supply issue at a structural level. Ocean City contains far fewer single-family homes than condominium units. So when a waterfront single-family home comes up in a given price band, there may be only a handful of comparable properties trading in an entire year, compared with a much larger pool of condominium sales.

The practical consequence is clear: if you are shopping for a single-family home in Ocean City, you need to be ready to decide quickly, and you need financing arranged before you look.

If you are shopping for a condominium, you may have more time and more selection, but the document review and building comparison become more important.

Ownership is different too.

In a single-family home, you carry your own insurance, maintenance, storm preparation, lawn care, winterizing, exterior systems, and repairs. Many owners want exactly that.

Condominium owners often want the opposite: arrive, unlock it, use it, lock it, leave.

Neither is better.

They are different products for different owners, and choosing the wrong one is one of the most expensive mistakes in this market.


5 Mistakes People Make When Choosing A Realtor

Common mistakes people make when choosing a Realtor in Ocean City MD

1. Choosing On Review Count Alone

Reviews matter, and we are glad to be judged on ours.

But a high review count tells you an agent has closed a lot of transactions. It does not automatically tell you whether they have closed transactions like yours.

Read what the reviews actually describe. Do they talk about communication? Pricing strategy? Condo knowledge? Negotiation? A difficult inspection? A rental property? A building-specific issue? A second-home purchase?

The details matter more than the stars.

2. Assuming Every Agent Understands Condominiums

Many do not, including experienced agents from other markets.

Ocean City condominium work is a specialty. Condo fees, reserve studies, insurance, master policies, rental restrictions, building management, financing reviews, and assessment risk can all affect the transaction.

Experience somewhere else does not automatically transfer.

3. Hiring Someone Who Does Not Know The Building

Building-level knowledge beats broad neighborhood knowledge here.

Ask directly: how many sales have you handled in this building, or buildings like it, and what should I know that is not obvious from the listing?

A good agent should have something useful to say.

4. Choosing On Fee Alone

Every fee is negotiable and every fee is a matter of agreement between you and the brokerage. If you are a buyer, the same is true on your side of the transaction; we explain how that works in who pays the buyer's agent in Ocean City.

The right question is not who is cheapest. The right question is what each agent will do for what they charge, whether they can explain it clearly, and whether the strategy fits the result you want.

A low fee attached to poor advice is not a bargain.

A higher fee attached to no clear plan is not a premium service.

Make the agent explain the value.

5. Confusing Availability With Expertise

Answering the phone quickly is necessary.

It is not sufficient.

You want responsiveness and judgment. You want an agent who will call you back and an agent who knows what to say when they do.

You should not have to trade one for the other.


Why We Are Worth Your Consideration

The Fritschle Barker Group, Ocean City MD real estate team

We are going to make our case with things you can check, rather than adjectives.

Grant Fritschle is a second-generation, born-and-raised Ocean City Realtor with 29 years in this market and more than 2,000 personal transactions. He learned the business from his father, Mark Fritschle, and has spent his entire career in the same few square miles.

Jon Barker brings more than two decades of local experience, with particular depth in negotiation and investment analysis.

Specific things that experience produced:

  • Our team helped launch the original sales effort at The Gateway Grand.
  • We understand the building-level differences that can separate two condos across the street from each other.
  • We can tell you why a number of Sea Watch condominiums were marketed as three-bedroom units, why many of those representations were inaccurate, and why that matters to what you pay.
  • Grant has recorded an explanation of what it actually takes to own and advertise a deeded boat slip in Ocean City, one of the most commonly misunderstood items in this market. Many buyers assume a slip conveys when it does not. The short video is below.
  • Our monthly market reports track Ocean City sales, pricing, inventory, days on market, and sub-market performance using Bright MLS data and local interpretation.

Disclosure: Grant is a co-owner of Central Reservations, an Ocean City vacation rental management company operating since 1978. We have a direct financial interest in that business. We name it here because it is relevant to what we know about rental performance in specific buildings, and you should weigh any rental advice we give with that interest in mind. You are never obligated to use Central Reservations, and plenty of our clients do not.

What A Team Structure Actually Changes

Most real estate team pages talk about teamwork in a way that sounds nice and means very little.

Here is the practical version, in Grant's words:

"Successful agents are very busy. And the benefit to us is, if we're busy, and if something comes up where I'm busy, I can turn over and turn to the chair next door and ask ... anybody on the team. Are they available and can they cover? ... So our clients are never left waiting, opportunities are never or very, very rarely missed."

And this:

"But it's also six heads are better than one. Seven heads are better than one. It's not just my experience that we're relying on. It's everybody. It's the cumulative effect of the experience and the expertise, and opinions, and everything else."

Every agent on our team is a producing agent, which is the distinction that matters.

Some teams are built as one lead agent with assistants. This one is not. When a question comes up about a building, a document, a buyer objection, a pricing strategy, or a negotiation issue, it goes to a group of people who have each closed transactions in this market. We wrote more about that model in what makes a strong real estate team in a resort market.

The practical benefit to you is coverage and judgment.

If your agent is at settlement when your building's association releases a document that needs to be read, somebody reads it that day.


Other Respected Ocean City Realtors Worth Considering

Other respected Realtors in Ocean City MD

A real disclaimer first: this is not a ranking, these are not "the five best," and we have no arrangement with any of them. They are five local professionals we have come to respect. There are others.

We include this because a page that pretends we are your only option is not actually trying to help you.

Kevin Decker

Commercial and Boardwalk properties, including Belmont Towers. Kevin came up through the same real estate family tree, learning the business alongside Grant and Jon and working with Grant's father, Mark Fritschle.

Worth a call if you are looking at commercial property or a building where he has handled multiple sales.

Nancy Reither

Single-family homes and bayside neighborhoods, with a consultative, one-to-one style.

Worth a call if you want unhurried advice on a unique property.

Nicole Callendar

Investor-focused and data-driven.

Worth a call if you want income analysis and numbers rather than impressions.

Lauren Bunting

Well regarded by peers, with extensive experience in higher-end listings and a direct communication style.

Worth a call if you want candor and discretion in a complicated situation.

Dave Whittington

Works both sides of the Maryland and Delaware line.

Worth a call if you are still deciding which state you want to be in, since the rules, taxes, and rental regulations differ.


How To Choose The Best Realtor In Ocean City MD

How to choose the right Realtor in Ocean City MD for your situation

Short answer: interview at least two agents, ask the eight questions below, and pay more attention to what they ask you than to what they tell you.

Grant's own position on being interviewed against other agents:

"I love it when sellers are interviewing multiple agents."

That is the right attitude to look for, and its absence is informative.

Eight Questions To Ask Any Ocean City Agent

  1. How many transactions have you closed in this building, or in buildings like it, in the last two years?
  2. Show me the comparable sales behind the price range you are giving me.
  3. What happens if we price above your range? How long could it take, and what might that cost me?
  4. What do you need to know about my situation before you can advise me?
  5. What is in the association documents that I should be worried about?
  6. Who answers my call when you are unavailable?
  7. What does your fee cover, specifically?
  8. Have you ever told a client you were not the right fit? What happened?

Question four is the one that separates people.

An agent who has a good answer has thought about your situation. An agent who does not is about to sell you a service instead of solving your problem.

If you want a longer list to bring to the appointment, we keep one in essential questions to ask a real estate agent before hiring them.

Then trust your read.

In our experience, it is usually right.


Frequently Asked Questions

Frequently asked questions about choosing a Realtor in Ocean City MD

Who are the best real estate agents in Ocean City MD?

There is no single best agent for everyone. The best agent for you is the one whose experience, market knowledge, communication style, and transaction history match your specific goals and property type.

How do I choose a Realtor in Ocean City MD?

Interview at least two agents. Ask what they need to know about your situation, ask to see the data behind any price they quote, and ask what they have closed in your building or in buildings like it. Pay close attention to whether the conversation is mostly about you or mostly about the agent.

How much do Realtors charge in Ocean City MD?

Commission is fully negotiable and is set by agreement between you and the brokerage you hire. There is no standard, customary, or required rate. Ask each agent to explain in writing what their fee covers.

Should I use a local Ocean City agent or my agent from home?

In most cases, local. Ocean City's market turns on building-specific facts, reserve studies, rental rules, insurance structure, condo fees, and assessment history that an out-of-area agent may not know. Your agent from home may be excellent in your primary market and still not be the right fit for an Ocean City condo or waterfront purchase.

Why does this guide name other agents?

Because a guide that pretends we are your only option would not be useful. We would rather you find the right fit than simply hire us. The agents named here are not ranked, and we have no referral arrangement with them.

What makes Ocean City real estate different from other markets?

Ocean City is a resort market where most purchases are discretionary, inventory is heavily condominium-based, and property performance varies enormously building by building rather than neighborhood by neighborhood.

Is it better to work with an agent who specializes in condominiums?

Usually, yes, if you are buying or selling a condo. Condominium transactions in Ocean City can involve reserve studies, association financials, rental restrictions, insurance structure, master policies, owner occupancy, financing reviews, and assessment risk. Those issues rarely appear in ordinary single-family transactions.

Should I interview more than one agent?

Yes, and a good agent will encourage it. Reluctance to be compared is itself a signal.


Why You Can Trust This Guide

This guide was written by The Fritschle Barker Group at Keller Williams Realty of Delmarva and is based on our own transaction experience in this market, Bright MLS data, and our published monthly market reports.

Grant Fritschle is a second-generation Ocean City Realtor with 29 years of experience and more than 2,000 personal transactions. Jon Barker brings more than 20 years of local experience. Grant is also a co-owner of Central Reservations, disclosed above, which gives him additional insight into vacation-rental performance and ownership patterns in Ocean City.

The team holds a five-star rating across more than 100 Google reviews. Two of those reviews come from people who work in this industry and evaluate agents professionally. Both are unsolicited public reviews left by former clients, and neither reviewer has a referral, compensation, or business relationship with our team in either direction.

"I’ve been in the mortgage business since 2001 and have had the opportunity to work with many agents over the years ... I can say with complete confidence that Grant is the best agent to work with in OCMD. His professionalism, local expertise, and personality are all top-notch ... When it came time to sell, his pricing strategy was spot on. We generated immediate interest, received multiple offers above asking price, and sold the home in just 13 days—during a slower time of year."

Michael Izzi, Mortgage Industry Professional

"Grant and his team are absolutely PHENOMENAL! I recommended them to a client of mine who wanted to purchase a beach house/vacation home, and they knocked it out of the park. Their high level service and communication make them a stand out real estate team. As a fellow real estate agent, they exceeded my expectations with my referral and they will continue to get my recommendation as THE go to for Ocean City!"

Brette Campbell, Fellow Real Estate Agent

Trust source disclosure: This article was researched, written, reviewed, and prepared by real members of The Fritschle Barker Group. Artificial intelligence tools may be used for editing, formatting, and readability. All market insights, opinions, and recommendations are based on firsthand local experience, verified MLS data, published market reports, and decades of serving buyers and sellers throughout Ocean City, Maryland and the Delaware beaches.


Best Realtors in Ocean City MD

Your Top Ocean City, MD Real Estate Agents

Today, they are recognized nationally as a top-performing group of charismatic, skilled Agents deeply connected to the vibrant towns of the Eastern Shore. More than agents, they are trusted advisors and community advocates, blending local knowledge with national strategy to deliver exceptional results.

The Fritschle Barker Group at Keller Williams Realty of Delmarva adheres to all Fair Housing Act guidelines and NAR ethical standards.

June 5, 2026

Ocean City MD Real Estate Market Report | May 2026

Ocean City MD Real Estate Market Report May 2026 showing condo prices, home values, inventory trends, and market activity

Ocean City MD Real Estate Market Report | May 2026

Last Updated: May 2026. Based on closed Bright MLS sales in the Direct Oceanfront, Oceanfront Indirect View, Ocean Block, Bayside Interior, Bayside Waterfront, and West Ocean City MLS areas (80 through 85), plus current active, pending, and under-contract inventory. For newer numbers, see the Ocean City MD June 2026 Real Estate Market Report.

If All You Look At Is Inventory, You Might Think Buyers Have The Advantage

Inventory is the highest we've seen in this dataset.

Days on market are rising.

More sellers are competing for attention.

Buyers have more options than they did a year ago.

So naturally, you'd expect prices to be softening.

Except they're not.

Median prices climbed 6% year over year.

Price per square foot climbed 6% year over year.

Nearly one-third of buyers paid cash.

And properly priced properties continue to disappear from the market in days.

That's what makes the Ocean City real estate market so interesting right now.

The headlines suggest one story.

The actual data suggests another.

One thing I've been watching closely this spring is the growing gap between properties priced at the most recent comparable sale and properties trying to push beyond it. Buyers remain active. They're simply becoming more selective.

May reinforced that trend.

The market rewarded realistic sellers.

The market ignored unrealistic ones.

And as inventory continues to grow, that distinction is becoming more important, not less.


Quick Answer: How Is The Ocean City MD Real Estate Market In May 2026?

Key Takeaways

  • May 2026 produced 117 closings, the strongest month of the year so far.
  • Total sales volume reached $61.3 million.
  • Median sold price increased 6.0% year over year to $445,000.
  • Average price per square foot increased 6.0% to $421, confirming genuine appreciation.
  • Inventory expanded to approximately 4.5 months of supply, creating more buyer choice.
  • About 32% of buyers paid cash.
  • 27% of all sales went under contract in 10 days or less.
  • 168 properties were pending or under contract at month end, pointing toward another strong month ahead.

Quick Answer

The Ocean City and West Ocean City real estate market closed 117 sales in May 2026 totaling $61.3 million, making it the strongest month of the year so far and up from April's revised 102 closings.

The median sold price rose to $445,000, up 6.0% year over year and 4.3% month over month.

Average price per square foot climbed to $421, also up 6.0% year over year, confirming that the increase reflects actual market appreciation rather than a change in what happened to sell.

Inventory continued to build, pushing median days on market to 44 days and creating roughly 4.5 months of supply. Even so, well-priced properties continued to move quickly, with more than one-quarter of all sales going under contract within 10 days.

Perhaps most importantly, 168 properties remained under contract or pending at month end, suggesting the market's momentum is likely to continue into June.


Grant's Market Minute

Grant fritschle's thoughts on the ocean city md real estate market

Most people will look at this report and focus on one number.

The 117 sales.

Others will focus on the 6% increase in median price.

Both matter.

But neither is the most important story.

The most important story is that inventory is growing while prices continue to rise.

Normally, those two forces work against one another.

More inventory usually means more competition and slower appreciation.

Instead, we're seeing more listings, more buyer choice, and continued price strength.

That tells me demand remains healthier than many people realize.

Ocean City isn't experiencing the frenzy we saw during 2021 and 2022.

But we're also not seeing weakness.

We're seeing normalization.

And that's actually a very healthy place for a market to be.


What Most People Will Miss In These Numbers

People miss this fact in the ocean city real estate market

Most market reports focus on what happened.

The better question is why it happened.

Here's what stands out to me:

Inventory is the deepest we've seen in our dataset.

Buyers have more options.

Days on market are increasing.

Yet prices continue to move higher.

That combination tells us something important.

Demand hasn't disappeared.

Buyers are simply becoming more disciplined.

They're willing to pay strong prices for properties that make sense.

They're much less willing to overpay for properties that don't.

That's why we're seeing such a dramatic difference between listings that are priced correctly and listings that are reaching beyond the most recent comparable sales.

The market isn't punishing sellers.

It's rewarding realism.


May 2026 Market Snapshot

Ocean City MD real estate market statistics May 2026 showing prices, inventory, and sales activity

Here's where the Ocean City and West Ocean City housing market stands as of the end of May 2026.

Important Note: April 2026 figures below reflect an upward revision from the originally reported 98 sales and $46.0 million in volume to 102 sales and $49.1 million after late-reporting Bright MLS data settled. May's figures may also increase slightly as additional sales are finalized and reported.

Metric May 2026 Apr 2026 (Rev.) MoM May 2025 YoY
Units Sold 117 102 +14.7% 115 +1.7%
Total Sold Volume $61,312,100 $49,094,837 +24.9% $57,259,080 +7.1%
Median Sold Price $445,000 $426,450 +4.3% $420,000 +6.0%
Average Sold Price $524,035 $481,322 +8.9% $497,905 +5.2%
Avg Price Per Sq Ft $421 $408 +3.2% $397 +6.0%
Median Days On Market 44 34 +10 days 41 +3 days
Average Days On Market 76 82 -7.3% 71 +7.0%
List-To-Sale Ratio 97.9% 97.5% +0.4 pt 97.7% +0.2 pt
Sold At/Above Asking 37 (32%) 22 (22%) n/a 35 (30%) n/a
Sold Below Asking 80 (68%) 80 (78%) n/a 80 (70%) n/a

Source: Bright MLS. Includes Ocean City and West Ocean City closed sales over $50,000.

Month Median Price Trend

Ocean City MD Median Price trends by month

Median sold price by month, June 2025 through May 2026. Source: Bright MLS, Ocean City and West Ocean City.

Is the Ocean City market up or down? Up. May 2026 closed 117 sales at a $445,000 median, with volume up 7% and prices up 6% year over year.

Here's The Simple Version

More properties sold.

Prices rose.

Buyers had more choices.

Cash buyers remained active.

And well-priced properties continued to attract strong attention.

That is the simplest explanation of May.


What The Numbers Tell Us

Price Strength Is Real

The median sold price increased 6.0% year over year.

Price per square foot increased 6.0% year over year.

When both metrics move together, it confirms that the gain reflects actual appreciation rather than simply a shift toward more expensive properties selling.

That's an important distinction.

It tells us values are genuinely moving higher.

May Was The Strongest Month Of 2026

Closings have steadily increased throughout the year:

  • January: 60 sales
  • February: 81 sales
  • March: 97 sales
  • April: 102 sales
  • May: 117 sales

The pending activity we highlighted last month translated directly into closed sales.

That's exactly what we expected.

Inventory Is Finally Having An Impact

This is probably the most important trend for buyers and sellers to understand.

Inventory now sits at approximately 4.5 months of supply.

That is the deepest level we've seen in this dataset.

More inventory means more competition.

More competition means buyers can be selective.

That's showing up in days on market.

Median days on market increased from 34 days to 44 days.

But here's the nuance many people miss:

More than one-quarter of all May sales went under contract in 10 days or less.

At the same time, 16 properties sat on the market for six months or longer.

Those slower listings pulled the average upward.

The market isn't slowing equally.

It's separating.

Well-priced properties are moving.

Overpriced properties are sitting.

Market Commentary

One thing we hear frequently from both buyers and sellers is:

"How can inventory be rising if prices are still going up?"

The answer is that inventory is only one side of the equation.

Demand matters too.

And demand remains healthy.

A growing inventory doesn't automatically create a buyer's market.

It creates options.

What buyers do with those options determines what happens next.

So far, buyers continue to show a willingness to pay strong prices for properties that are properly priced and properly positioned.

That's why median prices, price per square foot, and list-to-sale ratios all remain strong.


Ocean City Sub-Market Breakdown

Ocean City MD real estate market breakdown by location and property type

Sales By MLS Location

Location Sales Median Price Avg $/Sq Ft Avg DOM
Direct Oceanfront 21 $591,000 $576 62 days
Oceanfront Indirect View 7 $699,900 $525 55 days
Ocean Block 20 $327,500 $464 84 days
Bayside Interior 31 $415,000 $357 81 days
Bayside Waterfront 20 $375,000 $425 75 days
West Ocean City 18 $586,000 $261 83 days

Key Takeaways By Segment

Direct Oceanfront Reawakened

Direct Oceanfront jumped from 13 sales in April to 21 sales in May.

That segment was largely responsible for April's softer year-over-year comparisons.

Its return played a significant role in May's stronger performance.

Bayside Interior Led The Market

With 31 sales, Bayside Interior once again produced the highest transaction volume.

Its median price climbed to $415,000, reflecting a stronger mix of larger bayside units than we saw in April.

West Ocean City Remains Strong

West Ocean City posted 18 sales with a median price of $586,000.

Its lower price-per-square-foot figure reflects product type rather than weakness, as larger single-family homes dominate the segment.

Ocean Block And Bayside Waterfront Stayed Active

Both segments recorded 20 sales each and continue to represent strong middle-market opportunities for buyers looking for value relative to oceanfront inventory.

Oceanfront Indirect View Produced The Highest Median

At $699,900, Oceanfront Indirect View posted the highest median price.

However, with only seven sales, buyers and sellers should be cautious about reading too much into a small sample size.


Street Location Breakdown

One of the more interesting trends in Ocean City real estate is how dramatically performance can vary by location.

Buyers often focus on the building itself, but location remains one of the strongest drivers of long-term value, rental demand, appreciation potential, and resale performance.

Sales By Street Range

Area Sales Median Price Avg $/Sq Ft
South of 28th Street 17 $420,000 $452
29th to 60th Street 21 $369,900 $477
61st to 90th Street 13 $480,000 $468
91st to 120th Street 23 $415,000 $467
121st Street & North 25 $440,000 $404
West Ocean City 18 $586,000 $261

What This Means

A few patterns stand out once the numbers are in.

Midtown carries the highest price per square foot on the island. The 29th to 60th Street corridor led at $477 per square foot, even though its median sold price ($369,900) was the lowest on-island figure. That combination reflects a heavier mix of smaller condos rather than softer pricing.

North Ocean City was the busiest on-island stretch. The 91st Street and north corridors combined for nearly half of the island's sales, generally offering larger floor plans and quieter surroundings, with medians in the $415,000 to $440,000 range and a lower price per square foot.

West Ocean City carried the highest median at $586,000. Its low price per square foot ($261) reflects larger single-family homes rather than discounts.

Downtown, south of 28th Street, held steady at 17 sales and a $420,000 median, and continues to draw buyers and investors who prioritize proximity to the Boardwalk.


Price Range Analysis

Price range analysis for ocean city md real estate

Inventory is growing, but not equally across every price point.

Understanding where buyers are active can help both buyers and sellers position themselves more effectively.

Price Range Sales
Under $250K 5
$250K to $399K 40
$400K to $599K 42
$600K to $799K 14
$800K to $999K 10
$1M+ 6

The Story Behind The Numbers

The heart of the Ocean City market continues to live between $250,000 and $600,000.

That segment accounted for approximately 70% of all May sales.

Why?

Because it represents the sweet spot for:

  • Second-home buyers
  • Vacation home buyers
  • Investment property buyers
  • First-time beach property buyers

The luxury market remains active as well.

Six properties closed above $1 million during May, confirming continued strength at the top end of the market.

What has changed is buyer scrutiny.

Luxury buyers remain active.

They're simply demanding stronger value, better condition, and more realistic pricing than they did during the pandemic-era frenzy.


Bedroom Count Analysis

Ocean City real estate market breakdown by bedroom may 2026

Bedroom count continues to have a meaningful impact on pricing, demand, and marketability.

Bedrooms Sales Median Price
Studio 2 $243,450
1 Bedroom 21 $307,500
2 Bedroom 42 $413,750
3 Bedroom 34 $540,500
4+ Bedroom 18 $722,500

Key Takeaways

Two-bedroom properties remain the backbone of the Ocean City real estate market.

They offer:

  • Broad buyer appeal
  • Strong vacation rental demand
  • Manageable ownership costs
  • Better inventory selection

Three-bedroom properties continue attracting both families and higher-end investors seeking stronger rental potential and greater flexibility.

At the luxury end, four-bedroom and larger properties remain the scarcest segment and continue commanding premium pricing, with a median of $722,500.


Notable Sales From May

Notable real estate sales in Ocean City MD May 2026

Several transactions stood out during May and help illustrate where buyer demand remains strongest.

2 15th St #505 (Miramar), Ocean City - $1,600,000
3BR | Direct Oceanfront | 207 Days on Market | Closed at 98% of asking
The month's top sale. A premium oceanfront unit that found its buyer after an extended marketing period, a reminder that even the best locations sell when the price meets the market.

14100 Wight St #101 (Elbow Beach), Ocean City - $1,490,000
3BR | Direct Oceanfront | 1 Day on Market | Closed at 100% of asking
Priced right and gone in a single day at full price. The clearest example of the pricing-discipline message this month.

13028 Old Bridge Rd, Berlin (West Ocean City) - $1,480,000
4BR | Single-Family | 3 Days on Market | Closed at 101% of asking
A West Ocean City seven-figure single-family sale that closed above asking in three days. West OC's larger-home product continues to draw buyers.

1533 Teal Dr, Ocean City - $1,275,000
5BR | Bayside Interior | 28 Days on Market | Closed at 117% of asking
The bidding-war story of the month, closing well above list. A reminder that competition is alive on the right property.

6 62nd St #202 (Ocean Whisper), Ocean City - $1,145,100
4BR | Ocean Block | 30 Days on Market | Closed at 92% of asking
A large ocean block unit that negotiated to a number both sides could live with.

These sales reinforce an important theme throughout this report:

Properties offering strong value, unique features, exceptional condition, or premium locations continue attracting aggressive buyer attention.


Pending Sales & June Outlook

Outlook on the june real estate market in ocean city md prediction from may

One of the strongest leading indicators in real estate is what's already under contract.

At the end of May:

  • 168 properties were pending or under contract
  • Pending volume remained elevated
  • Showing activity remained healthy
  • New inventory continued entering the market

Those are generally positive signals heading into June.

Why June Could Be Strong Again

The current pipeline suggests June has the potential to produce another healthy month of closings.

That doesn't mean every segment will outperform.

But the overall market appears to have sufficient buyer demand to absorb the growing inventory supply.

As always, we'll know more once the numbers are finalized.

But right now, the leading indicators remain encouraging.

Will June be strong in Ocean City? The leading indicators point that way. 168 properties were pending or under contract at the end of May, with 128 carrying agreements signed in May or later.


Cash Buyers Continue To Shape The Market

What percent of ocean city md buyers are cash

Approximately 32% of May buyers paid cash.

That figure remains remarkably consistent with historical Ocean City trends.

Why does this matter?

Cash buyers create:

  • Faster transactions
  • Greater certainty
  • Stronger negotiating leverage
  • Reduced financing risk

Ocean City has always attracted a higher percentage of cash buyers than many traditional residential markets because:

  • Second-home ownership is common
  • Retirement buyers are active
  • Investors remain involved
  • Many buyers are using proceeds from prior real estate sales

For sellers, understanding the role of cash buyers remains an important part of pricing and negotiation strategy.

What percent of Ocean City buyers pay cash? About one in three. 32% of May 2026 closings were cash purchases, in line with the roughly 30% to 37% range over the past year.


What This Means For Buyers Right Now

If you're a buyer, this is probably the healthiest market environment we've seen in several years.

You have:

  • More inventory
  • More negotiating opportunities
  • Less competition
  • More time to evaluate options

That doesn't mean every property is a bargain.

Far from it.

The best properties still move quickly.

But buyers now have the ability to compare, analyze, and negotiate in ways that were difficult during 2021 and 2022.

One thing we've been telling buyers repeatedly this spring:

Don't confuse a more balanced market with a weak market.

The market remains healthy.

It's simply more rational.

For many buyers, that's actually good news.


What This Means For Sellers Right Now

For sellers, the message is straightforward:

Pricing matters more than it did a year ago.

Condition matters more than it did a year ago.

Presentation matters more than it did a year ago.

The market is still rewarding good properties.

It's simply less forgiving of unrealistic expectations.

The sellers achieving the strongest results today are typically:

  • Pricing close to recent comparable sales
  • Presenting properties well
  • Addressing deferred maintenance
  • Marketing aggressively
  • Responding quickly to market feedback

The days of simply naming a price and waiting for multiple offers have largely passed.

But well-positioned properties continue performing very well.


Frequently Asked Questions

Frequently asked questions about Ocean City MD real estate

Is Ocean City Currently A Buyer's Market Or Seller's Market?

Ocean City currently sits in a more balanced market environment than we've seen in recent years. Inventory has increased, giving buyers more options, while continued price appreciation and strong demand continue supporting sellers.

Are Ocean City Condo Prices Still Rising?

Yes. Median sold price increased 6.0% year over year in May 2026, while average price per square foot also increased 6.0%, confirming genuine market appreciation.

Why Are Days On Market Increasing If Prices Are Rising?

Growing inventory has given buyers more choices, allowing them to be more selective. Well-priced properties continue selling quickly, while overpriced listings often remain on the market longer, increasing average marketing times.

Is Now A Good Time To Buy In Ocean City?

For many buyers, yes. Inventory levels are higher, competition is lower than during the pandemic years, and buyers have greater negotiating leverage while still participating in a market that has shown continued long-term appreciation.

Are Cash Buyers Still Important In Ocean City?

Absolutely. Roughly one-third of May buyers paid cash, making cash transactions a significant factor in the local market.

What Types Of Properties Are Selling Fastest?

Properties that are properly priced, well maintained, in desirable locations, move-in ready, and backed by strong amenities or views continue attracting the fastest buyer response.


Market Outlook

As we move into summer, the Ocean City real estate market appears to be transitioning toward something many buyers and sellers haven't experienced in several years:

Normal.

Inventory is healthier.

Negotiations are more common.

Buyers have choices.

Sellers still have opportunities.

Prices continue rising, but at a more sustainable pace.

From our perspective, that's a positive development.

Healthy markets create confidence.

And confidence tends to support long-term stability.

The biggest thing we'll be watching next month is whether inventory growth begins to outpace buyer demand.

So far, demand continues holding up remarkably well.


Why You Can Trust This Report

Unlike many market reports that rely solely on automated national datasets, this report combines:

  • Bright MLS sales data
  • Active market participation
  • Buyer consultations
  • Seller consultations
  • Showing activity
  • Inventory analysis
  • Contract activity
  • Nearly three decades of firsthand Ocean City real estate experience

This report is designed to provide practical market intelligence, not sensational headlines.

The goal is simple: help buyers, sellers, investors, and property owners better understand what's actually happening in the Ocean City real estate market.

About The Author

Grant Fritschle is a second-generation Ocean City Realtor and co-founder of The Fritschle Barker Group at Keller Williams Realty of Delmarva.

With nearly 30 years of experience and more than 2,000 personal transactions, Grant specializes in:

  • Oceanfront condominiums
  • Waterfront homes
  • Investment properties
  • Vacation homes
  • Luxury real estate
  • Resort market analysis

Grant is also co-owner of Central Reservations, one of Ocean City's largest vacation rental management companies, providing him with a unique perspective on both property ownership and rental performance.

His market reports combine real-world transaction experience, local market expertise, and MLS data analysis to help consumers make informed decisions.

Data Source: Bright MLS. Statistics reflect closed sales reported through May 31, 2026 for Ocean City and West Ocean City MLS areas. Figures may be revised as additional sales are reported.

Trust Source Disclosure: This report was researched, written, reviewed, and interpreted by real members of The Fritschle Barker Group. Artificial intelligence tools may be used for editing, formatting, readability enhancements, and content refinement. All market analysis, observations, and opinions reflect local expertise, MLS data, and firsthand experience serving Ocean City and Delaware beach real estate clients.

Best Realtors in Ocean City MD

Your Top Ocean City, MD Real Estate Agents

Today, they are recognized nationally as a top-performing group of charismatic, skilled Agents deeply connected to the vibrant towns of the Eastern Shore. More than agents, they are trusted advisors and community advocates, blending local knowledge with national strategy to deliver exceptional results.

The Fritschle Barker Group at Keller Williams Realty of Delmarva adheres to all Fair Housing Act guidelines and NAR ethical standards.

May 28, 2026

How Much Does an Ocean City MD Vacation Rental Actually Earn? The Honest 2026 Math

Ocean City MD vacation rental condos along the beach with the honest 2026 rental income math

How Much Does an Ocean City MD Vacation Rental Actually Earn? The Honest 2026 Math

Last Updated: May 2026. Based on trailing twelve-month rental performance data from 352 actively rented Ocean City vacation properties, recent Bright MLS sales activity, and local ownership cost analysis.

You’ve probably seen the ads claiming you can “Own a beach condo that pays for itself.” Or how about one of these claims…“Make $50,000+ a year renting your Ocean City property.” “Let your vacation home become passive income.”

And honestly? We understand why people believe it.

A quick Google search for “Ocean City MD Airbnb income” or “Ocean City vacation rental investment” pulls up national rental aggregators (a fancy way of saying AirDNA) showing eye-catching revenue numbers. The kind of numbers that make beach ownership feel like a great way to make easy money.

The problem is, those numbers are rarely accurate, and very rarely tell the whole story.

That doesn’t mean Ocean City is a bad place to buy. Quite the opposite!

It does mean that our market works differently than the internet makes it sound. Simply put….. much like you can’t rely on Zestimates to accurately price your home, don’t rely on these fake rental projections to rent your beach home.

After nearly 30-years helping buyers purchase Ocean City beach condos, vacation homes, second homes, and investment properties, Grant Fritschle has watched buyers make the same mistake over and over again:

They underwrite Ocean City like a year-round Airbnb market instead of what it actually is: a highly seasonal coastal second-home market built around lifestyle first, rental income second.

So instead of recycling national estimates or generic short-term rental projections, we pulled real trailing twelve-month rental performance data from 352 actively rented Ocean City vacation properties managed by Central Reservations (the Ocean City vacation rental company Grant Fritschle co-owns). We disclose that relationship clearly because transparency matters, and because this level of local rental data is only possible because of that connection.

What follows is probably the most honest picture of Ocean City vacation rental ownership you’ll find online.

Not hype.

Not fear.

Just reality.

And that reality shows it’s still a pretty compelling market to own a property in.

Key Takeaways

  • Across 352 actively rented Ocean City vacation properties, the median gross rental income was $18,680 over the trailing twelve months.
  • Rabbu’s widely cited Ocean City revenue estimate of roughly $51,609 aligns closely with the actual 90th percentile of the local rental portfolio.
  • A median 2BR Ocean City vacation rental earned roughly $12,800, while a median 3BR earned roughly $25,300.
  • Most Ocean City vacation rentals do not fully “pay for themselves,” but many meaningfully offset condo fees, taxes, insurance, utilities, and some mortgage payments.
  • The best way to evaluate Ocean City vacation rental ownership is through a four-part return: lifestyle use, long-term appreciation, tax advantages, and rental income that offsets carrying costs.
  • Engaged owners tend to outperform passive owners because property condition, guest experience, reviews, pricing, and repeat bookings all matter.
  • The happiest Ocean City owners are usually not chasing the biggest spreadsheet. They are building a place their family never stops coming back to.

Quick Answer: What Do Ocean City Vacation Rentals Actually Earn?

Across 352 actively rented Ocean City vacation properties over the past twelve months, the median gross rental income was $18,680 annually.

That number surprises people. Especially buyers who arrive expecting the $50,000+ income figures they’ve seen online.

One of the most commonly referenced national aggregators, Rabbu, currently estimates average Ocean City vacation rental income at roughly $51,609 per year.

Here’s the important context: That number aligns almost perfectly with the 90th percentile of locally managed properties in our dataset.

In plain English? About 1 out of every 10 Ocean City rentals reaches that level.

The other 90% earn less…significantly less. Often because most property owners actually use their beach-homes too. Sometimes a lot. And that impacts income.

That does not mean ownership here “doesn’t work.”

It means most buyers are measuring the wrong thing.

The people happiest with Ocean City ownership are usually not the people chasing the most aggressive cash-flow spreadsheet. They are the people who understand the full picture before they buy, while personally enjoying the property they worked hard to purchase.


What Most Ocean City Buyers Get Wrong

What most Ocean City vacation rental buyers get wrong

Most buyers don’t get into trouble because they bought the wrong property.

They get into trouble because they bought with the wrong expectations.

Ocean City is not typically a “buy it and quit your job” vacation rental market.

It is a market where smart buyers can:

  • Offset meaningful ownership costs
  • Create long-term family value
  • Build equity over time
  • Enjoy personal beach use
  • Capture potential tax advantages
  • Hold a property in one of the East Coast’s most established resort towns

That is a very different story than “passive income machine.” And frankly, it is a better story. Because it’s real.

Grant will be the first to tell his clients that Ocean City ownership works best when the decision is rooted in both math and lifestyle. The rental income matters, of course. But if you only look at the rental statement, you miss a huge part of the value.

You are not just buying a spreadsheet.

You are buying beach access, family traditions, future flexibility, long-term ownership, a place that can help carry some of its own costs along the way, while also offering tax benefits.

That is the realistic Ocean City model.


Internet Expectation vs. Realistic Ocean City Outcome

Category Internet Expectation Realistic Ocean City Outcome
2BR Condo Income $35,000 to $60,000+ Often closer to $18,000-$35,000, depending on building, condition, and view
Occupancy Year-round rental demand Highly seasonal demand concentrated from late May through mid-September
Ownership Goal Passive income Cost-offset lifestyle ownership
Best Owner Type Hands-off investor Engaged owner who cares about condition, reviews, and guest experience
Best Hold Period Short-term return Long-term ownership, often 5+ years
Rental Role Make the property “free” Offset meaningful carrying costs
Biggest Value Driver Rental calculator estimate Building, view, condition, pricing, ownership engagement, and long-term use

This is where Ocean City gets misunderstood.

National estimates can be helpful as a starting point, but they are not a substitute for local building-level rental history, local condo fee analysis, and real ownership cost modeling. If you want the framework we use to evaluate a specific property, start with our guide on how to choose the right condo building in Ocean City.


Why National Rental Calculators Get Ocean City Wrong

Why national rental calculators get Ocean City MD wrong

Most national short-term rental aggregators are built around markets with:

  • Year-round tourism
  • More consistent occupancy
  • Less severe seasonality
  • Fewer condo association restrictions
  • Lower operational complexity

Ocean City is different.

This is a highly seasonal beach market where the overwhelming majority of rental income is compressed into roughly 14 peak weeks between late May and mid-September.

That is a completely different business model than Scottsdale, Nashville, Charleston, Orlando, or Gatlinburg. Yet many national calculators treat them similarly.

They also struggle to account for local factors like:

  • Unit quality differences within the same condo building
  • Oceanfront vs. ocean block vs. bayside location
  • North Ocean City vs. Midtown vs. Downtown rental patterns
  • Condo fee increases
  • Reserve study requirements
  • Rental restrictions
  • Owner usage patterns
  • Weather-driven booking swings
  • Deferred maintenance
  • Management quality
  • Repeat guest behavior
  • Building reputation

The result? Buyers often arrive expecting “passive income.”

Then they discover Ocean City ownership is much more relationship-driven, operationally nuanced, and lifestyle-oriented than the internet suggested.

That’s not bad. In fact, we think it’s better. You get to use and enjoy your investment while it grows in value.


The Actual Numbers: Rental Income by Bedroom Count

Bedroom count remains the single biggest driver of rental performance in Ocean City.

Across the actively rented portfolio:

Bedrooms Properties Median Annual Rent 25th Percentile 75th Percentile
1BR 46 $8,198 $4,054 $11,965
2BR 114 $12,771 $6,950 $19,787
3BR 113 $25,291 $17,382 $39,023
4BR 24 $49,851 $38,771 $76,896

A few important things jump out immediately.

First, many 2BR buyers dramatically overestimate rental income.

A median 2-bedroom Ocean City condo earning roughly $12,800 annually is very different from the $35,000 to $55,000 projections buyers often see online. And it’s not ‘all’ that those 2-bedroom condos can earn? It’s all they ‘do’ earn, because most of them are also being used by their property owners.

Second, this is why some buyers feel “close” to national estimates while others feel wildly disappointed.

A strong 3BR or 4BR Ocean City vacation rental can absolutely produce meaningful revenue. But a smaller ocean block condo in a mid-range building is usually a different math equation entirely.

Third, the spread inside each bedroom category is massive.

Condition matters. View matters. The building matters. Upgrades matter. Management matters. And Owner expectations matter.

A 2BR condo in one building is not the same as a 2BR condo in another building. Even two units in the same building can perform very differently depending on floor height, finishes, calendar strategy, reviews, bedding setup, photography, and owner engagement.

Which brings us to one of the most important findings in the entire dataset.


The Engaged Owner Effect

This surprised even us.

Conventional wisdom says owners who use their property less should earn more rental income because they leave more nights available for guests.

But our data showed the opposite.

Owner Nights Blocked Per Year Properties Median Annual Rent
Almost never, 0 nights 18 $6,300
1 to 14 nights 76 $7,606
15 to 60 nights 204 $21,173
61+ nights 52 $27,450

Read that again.

The owners using their condos the most were often producing the strongest rental performance.

Why?

Because engaged owners operate differently.

They tend to:

  • Upgrade furnishings before they look tired
  • Replace mattresses before guests complain
  • Improve WiFi
  • Add smart locks
  • Keep kitchens well stocked
  • Refresh decor
  • Communicate with management
  • Optimize pricing and calendar strategy
  • Walk through the property between seasons
  • Care about reviews
  • Build relationships with repeat guests

In other words, they care.

And guests notice.

This might contradict the theory, and some of our claims that owner use reduced total income. To some extent that can be true. Especially if some of those owner holds are coming on the week of July 4th. But we’re showing you in the chart above, that it isn’t ‘always true. The owners who treat their Ocean City condo like a living asset generally outperform the owners who treat it like a forgotten spreadsheet. A few smart moves can go a long way, and our guide to the top ways to maximize your Ocean City vacation rental income walks through the ones that matter most.

That is something national aggregators cannot measure. And honestly, it is one of the biggest truths about Ocean City vacation rental ownership.

The best-performing properties aren’t accidental.


Who Typically Does Well Owning in Ocean City?

Who typically does well owning an Ocean City vacation rental

The happiest Ocean City owners plan to hold long-term, use the property personally, underwrite conservatively, understand seasonality, and treat rental income as support rather than salvation.

Ocean City ownership tends to work best for buyers who are honest with themselves from the beginning.

The happiest owners usually:

  • Plan to hold the property long-term
  • Use the property personally
  • Value family memories and lifestyle
  • Underwrite conservatively
  • Understand seasonality
  • View rental income as support, not salvation
  • Keep the property updated
  • Work closely with their management company
  • Talk to a CPA before buying
  • Buy a property they would still want to own even if the rental income is lower than expected

That last point matters.

If the only reason you are buying is because an online calculator said the numbers would be incredible, slow down.

If you love Ocean City, understand the seasonal rental model, can afford the property responsibly, and want your family to use it for years, now we are having the right conversation. That is also the moment our buyer’s guide to purchasing Ocean City vacation rentals becomes genuinely useful.


The Four-Part Return: The Real Ocean City Ownership Equation

The four-part return on Ocean City vacation rental ownership

This is the part most buyers never hear explained correctly. And spoiler alert. It's not as complex as the image above.

If you evaluate an Ocean City vacation rental only through pure cash flow, many properties will feel underwhelming.

That is because Ocean City ownership was never primarily designed around maximizing annual yield.

The buyers happiest here usually stack four separate returns together.

1. Personal Use Value

This is the part spreadsheets ignore completely.

If your family rents a beach condo for two weeks, three weeks, multiple long weekends, or every summer, those vacations already cost real money.

A family spending $4,000 to $8,000 per week renting premium Ocean City properties can easily spend $15,000 to $30,000+ annually on vacations they no longer need to pay for once they own.

That economic value is real even though it never appears on the rental statement.

And honestly?

This is where many long-term owners find the greatest return.

Not the rental checks.

The memories.

The traditions.

The spontaneous weekends.

The “our place at the beach” feeling.

That matters more than many buyers initially realize.

2. Long-Term Appreciation

Ocean City has remained one of the East Coast’s most resilient second-home markets for decades.

Will values fluctuate year to year?

Of course. Every market does.

But buyers holding quality property long-term have historically benefited from:

  • Constrained waterfront inventory
  • Strong second-home demand
  • Generational Ocean City loyalty
  • Consistent tourism
  • Retirement migration
  • Limited oceanfront supply
  • Strong local brand recognition as a resort town

Ocean City is not a trendy short-term rental market that appeared overnight.

This is a deeply established beach town with decades of proven demand behind it.

That’s an important fact. Especially for buyers planning a 10+ year ownership cycle.

3. Potential Tax Advantages

This is the area many buyers underestimate most.

Depending on personal use ratios, income structure, ownership structure, CPA strategy, and depreciation treatment, vacation rental ownership can create meaningful tax planning opportunities.

That may include:

  • Depreciation
  • Deductible operating expenses
  • Mortgage interest treatment
  • 1031 exchanges
  • Cost segregation strategies
  • Short-term rental tax treatment considerations

Some owners capture substantial value here.

Others never properly structure it and miss opportunities entirely.

This is why Grant consistently tells buyers to talk to a CPA before you buy, not after.

A real estate agent should not be giving you tax advice. But a good Ocean City real estate advisor should know enough to tell you when tax strategy needs to be part of the conversation.

4. Rental Income That Offsets Ownership Costs

Now we get to the part everyone focuses on first….And yes, rental income absolutely matters.

But the healthiest way to view Ocean City rental income is usually as:

  • Cost offset
  • Ownership support
  • Carrying-cost reduction

Not full financial replacement.

In many cases, rental income can help cover:

  • Condo fees
  • Property taxes
  • Insurance
  • Utilities
  • Rental license costs
  • Maintenance
  • Some mortgage payments

If you approach ownership realistically from the beginning, that can still be an excellent outcome.


Grant Fritschle’s Underwriting Rule

Grant Fritschle Ocean City vacation rental underwriting rule

After nearly three decades in Ocean City real estate and vacation rental management, Grant’s philosophy has stayed remarkably consistent:

“If your rental income covers your condo fees, your property taxes, and some of your mortgage payments each year, you are doing great. The numbers do not have to be a home run for ownership to make sense.”

“And remember, there are tax advantages to owning rental property that many buyers underestimate. Talk to a good accountant before you buy.”

That mindset can help buyer better plan, prepare and enjoy their beach-home, instead of creating unnecessary stress and anxiety.

Instead of asking “Will this property make me rich?”

The better question becomes “Does this property support your lifestyle, help offset ownership costs, while appreciating long-term, and fitting into your long-term goals?”

For many Ocean City buyers, the answer is yes. Very much yes.


Where the Math Looks Most Favorable

Where the math looks most favorable across Ocean City condo buildings

Not every Ocean City condo building performs the same.

Some buildings optimize for:

  • Lifestyle
  • Amenities
  • Luxury positioning
  • Ocean views
  • Boardwalk access
  • Long-term appreciation
  • Building reputation

Others produce stronger relative cash yields due to:

  • Lower entry prices
  • Lower condo fees
  • Strong rental demand relative to purchase price
  • Efficient floor plans
  • Lower carrying costs

After joining trailing rental data with recent Bright MLS sales, here’s where some Ocean City condo buildings currently stand: (these are median ranges, not the top-end ranges)

Building Median Annual Rent Median Sale Price HOA + Tax Net Yield
South Beach $65,825 $1,100,000 $29,329 3.32%
Carousel $25,291 $560,000 $10,551 2.63%
Belmont Towers $49,558 $999,500 $24,538 2.50%
Adagio $30,373 $627,500 $17,819 2.00%
Sea Watch $21,119 $578,750 $11,408 1.68%
Golden Sands $19,937 $514,500 $11,554 1.63%
Gateway Grand $39,924 $1,299,000 $22,165 1.37%

A very important reminder:

Higher yield does not automatically mean “better property.”

Some buyers prioritize:

  • Premium amenities
  • Long-term appreciation
  • Luxury ownership
  • Oceanfront exposure
  • Parking
  • Building management
  • View quality
  • Personal enjoyment

Gateway Grand buyers, for example, are often optimizing for an entirely different ownership experience than buyers targeting maximum yield efficiency.

Golden Sands, Sea Watch, Belmont Towers, Carousel, Adagio, and South Beach all speak to different buyer profiles.

The best building depends entirely on your ownership goals.

This is why building-level knowledge matters so much in Ocean City. A generic rental calculator cannot tell you which condo association has strong reserves, which building has pending assessment risk, which floor plans rent best, or which locations tend to attract repeat guests.

That is local advisor work.


A Realistic Ocean City Owner Story

A realistic Ocean City vacation rental owner story

Let’s make this practical. Meet Mike.

Mike is fictional, but he represents dozens of real buyers we’ve worked with over the years.

He’s 52. He lives in suburban Pennsylvania. He has rented Ocean City condos for nearly a decade. And eventually Mike asks the same question thousands before him have asked….

“We’re spending this money every year anyway. Shouldn’t we just own a beach place?”

Mike finds a nice 2BR ocean block condo listed around $475,000.

Online calculators estimate $44,000+ annual rental income.

Then our team pulls ‘real’ rental projections and performance history.

The Reality? That income is closer to $21,000 gross annual rent.

At first, that feels like a letdown. But then Mike realizes:

  • His family no longer wastes $14,000+ annually renting
  • He gets spontaneous weekends whenever he wants
  • His CPA identifies meaningful depreciation opportunities
  • He plans to retire to the property eventually
  • Rental income offsets much of the carrying cost
  • His family now has “their place” at the beach

That’s when Ocean City ownership starts making more sense emotionally and financially together.

Not because it’s a perfect spreadsheet. But because it’s a realistic long-term lifestyle investment.

That’s what a smart rental property looks like in Ocean City. It’s not like purchasing stocks… it’s about considering all the benefits and value it provides and calculating those together.


Methodology & Data Sources

Methodology and data sources for the Ocean City rental income analysis

This analysis combines:

  • Trailing twelve-month rental performance data from 352 actively rented Ocean City vacation properties managed by Central Reservations
  • Recent Bright MLS closed sales activity
  • Ocean City condo building-level sales data
  • Annual condo fee and tax estimates
  • Local vacation rental operating cost assumptions
  • Firsthand underwriting experience from the Fritschle Barker Group
  • Nearly 30 years of Grant Fritschle’s resort real estate advisory experience

This article is intended as educational market analysis, not investment, legal, or tax advice. Buyers should consult a qualified CPA, lender, attorney, and local real estate advisor before purchasing an Ocean City vacation rental or investment property.


Final Thoughts: Ocean City Was Never Meant to Be a Get-Rich-Quick Market

Ocean City was never meant to be a get-rich-quick rental market

This market gets misunderstood online.

Ocean City rarely creates overnight short-term rental millionaires.

What it does create is:

  • Long-term family ownership
  • Generational beach traditions
  • Meaningful appreciation
  • Memorable experiences
  • Properties that partially carry themselves while your family enjoys them for years

The buyers happiest with ownership here are usually the buyers who:

  • Underwrite conservatively
  • Understand the seasonality
  • Value lifestyle return
  • Think long-term
  • Stay engaged
  • Treat rental income as one piece of the ownership equation

That’s not pessimism. That’s smart buying.

And frankly, it’s one of the reasons Ocean City has remained such a durable second-home market for decades. If you are still weighing the timing, our take on whether you should buy in Ocean City in 2026 pairs well with everything above, as does our look at how buying a beach house in Ocean City can actually make financial sense.

The owners happiest with Ocean City real estate are rarely the ones chasing the biggest spreadsheet.

They’re the ones building a place their family never stops coming back to.


Frequently Asked Questions

Ocean City MD vacation rental frequently asked questions

How much rental income can I expect from an Ocean City MD vacation rental in 2026?

Across 352 actively rented properties managed by Central Reservations over the past twelve months, the median gross annual rental income was $18,680. A median 2BR earned roughly $12,800 annually, while median 3BR properties earned roughly $25,300. While our highest grossing properties were well into the $150,000+ range. Rental income varies significantly by bedroom count, building, view, condition, calendar strategy, and owner engagement.

Are AirDNA and Rabbu projections accurate for Ocean City?

Generally, no. National aggregators often project numbers closer to the top 10 to 20% of actual Ocean City rental performance because they model the market like a year-round short-term rental destination rather than a highly seasonal beach market. They are useful for directional awareness, but not for underwriting.

Will an Ocean City vacation rental pay for itself?

Usually not entirely. Most Ocean City rentals offset a meaningful portion of ownership costs rather than fully eliminating them. Buyers who approach ownership realistically tend to view rental income as cost reduction layered on top of personal use, appreciation, and potential tax benefits.

Which Ocean City buildings produce the strongest rental performance?

Yield varies dramatically depending on building type, condo fees, location, amenities, view quality, and purchase price. Buildings like South Beach, Carousel, Belmont Towers, and Adagio show relatively stronger net yield metrics in this dataset, while buildings like Gateway Grand may attract buyers prioritizing amenities, oceanfront ownership, long-term appreciation, or personal use.

Is now a good time to buy an Ocean City vacation rental?

Inventory levels are deeper than they’ve been in several years, giving buyers more options and negotiating leverage than they had during the hyper-competitive post-2020 market. Buyers who underwrite realistically and think long-term are finding meaningful opportunities in the current market.

What is the biggest mistake Ocean City vacation rental buyers make?

The biggest mistake is using inflated online rental projections instead of real local rental performance data. The second biggest mistake is focusing only on gross rent while ignoring condo fees, taxes, insurance, utilities, maintenance, owner usage, and long-term building risk.

What type of buyer is usually happiest owning in Ocean City?

The happiest buyers usually want both lifestyle and financial support from the property. They use the condo personally, hold long-term, understand seasonal rental income, and treat the rental income as a way to offset carrying costs rather than fully eliminate them.

About the Authors

This analysis was researched and written by the Fritschle Barker Group at Keller Williams Realty of Delmarva, led by Grant Fritschle.

Grant is a second-generation Ocean City Realtor with nearly 30 years of resort real estate experience and more than 2,000 personal transactions. He is also co-owner of Central Reservations, the Ocean City vacation rental management company operating since 1978 that provided the rental performance data used throughout this article.

We disclose that relationship openly because transparency matters, and because it is what makes this level of local rental analysis possible.

Jon Barker brings more than 20 years of Ocean City real estate experience and consistently ranks among the area’s top-producing luxury Realtors.

Together, the Fritschle Barker Group specializes in helping buyers make informed, realistic, long-term beach ownership decisions grounded in actual market knowledge rather than internet hype.

“Grant has been a great real estate partner since 2017 to our family; we’ve purchased two properties with Grant and are currently renting one as a seasonal rental. He’s extremely responsive and knows the market inside and out. Grant always goes above and beyond. We would recommend Grant — whether you’re selling or buying and whether it’s a personal or investment transaction!”

Christina W., Google review

For more Ocean City real estate insights, market analysis, and local expertise, visit grantf.com or learn more about Grant Fritschle and Jon Barker.

Best Realtors in Ocean City MD

Your Top Ocean City, MD Real Estate Agents

Today, they are recognized nationally as a top-performing group of charismatic, skilled Agents deeply connected to the vibrant towns of the Eastern Shore. More than agents, they are trusted advisors and community advocates, blending local knowledge with national strategy to deliver exceptional results.

The Fritschle Barker Group at Keller Williams Realty of Delmarva adheres to all Fair Housing Act guidelines and NAR ethical standards.

May 25, 2026

Top Summer Activities In Ocean City MD 2026

Summer 2026 in Ocean City MD events activities and what is new guide by The Fritschle Barker Group

Summer 2026 in Ocean City, MD: Events, Activities, and What's New

Summer 2026 is shaping up to be one of the most eventful seasons Ocean City has put together in years. America's 250th anniversary draws international acts to the OC Air Show, the White Marlin Open expands to a six day format, new restaurants are opening across the island, and a handful of staples have changed. This is the local's guide to what's actually new, what's worth planning around, and what to know before you visit.


Quick Answer

Summer 2026 in Ocean City brings the OC Air Show with the U.S. Air Force Thunderbirds and France's Patrouille de France on June 13 and 14, a six day White Marlin Open from August 3 to 8, July 4 fireworks at two locations for America's 250th Anniversary, a wave of newer restaurants (like Oyster and Scales, Jolly Jellyfish, Seacrets Hideaway, and the soon to open Brasa on 33rd Street), plus free weekly family events at Northside Park. And yes, unfortunately the Boardwalk tram is closed this season.


Why Summer 2026 Is Different

Ocean City Maryland beach and boardwalk during summer 2026 season

We've been working in Ocean City real estate long enough to remember what a summer looked like long before the music festivals drew six figure crowds, and before the food scene started rivaling the best places in your hometowns. Our little beach town keeps changing... but the things we love the most have stayed the same.

This guide is built for the visitors who want to know what's new in Ocean City in 2026. To help show you everything that's new, we're sharing a calendar of places, events, and things to do so you can plan around it. This isn't a generic list. If you want a sweeping overview of everything fun in our town, our friends at Central Reservations put together a comprehensive vacation guide. What you'll find below is the local's guide to what's changed, what to book ahead, and what's worth your time.


What's New for Summer 2026

New Ocean City MD restaurants and businesses opening summer 2026 including Brasa Surfin Bettys and Core Club

The brand new spots opening this season

Brasa, 33rd Street. The former Guido's Burritos location has been gutted and rebuilt for a concept that combines Argentine asado grilling with Tuscan Italian cooking. Founder Rocco DiFilippo describes it as "fire, simplicity, and flavor," with premium meats, fresh seafood, and seasonal vegetables cooked over open flame. Targeted to open soon. Worth watching their website for the official opening date.

Surfin' Bettys Burger Bar, 127th Street. The Surfin' Bettys team has opened a second Ocean City location in the former Tony Luke's spot in North OC, complementing their original 15th Street location. Same char grilled Angus burger formula that built the brand, now more accessible to those in north OC.

The Core Club at 81st Street. The Core Club has been building a following in Berlin and Salisbury with their 50 minute reformer classes. This summer they're opening their first Heated Sculpt and Barre Studio in Ocean City proper, on 81st Street, with a sit down café and juice bar downstairs. This place has some of OC's freshest juices, coffee, light bites, and a workout space that takes wellness seriously. For those who want a different kind of beach week balance.


Newer spots you may not have tried yet

Three places worth knowing about if you haven't been to OC in a year or two:

Oyster and Scales, 306 Dorchester Street. Fine dining seafood on the bay with a Nantucket and Cape Cod oyster house aesthetic. Reservations recommended, especially for sunset tables.

Jolly Jellyfish Beach Club, 9800 Coastal Highway at The Plaza on 98th Street. Oceanfront casual bar and grill with outdoor dining, live music, and great vibes. Good lunch or happy hour stop if you want something laid back.

The Hideaway at Seacrets, 5005 Coastal Highway. Located right next to Seacrets but operating at a completely different register. Upscale bayside dining in midtown OC, mixology focused bar, chef driven menu, two bars with the bay in front of you. Open every day from 4 to 11 PM. Reservations recommended.


Summer 2026 Events Calendar

Ocean City MD summer 2026 events calendar including OC Air Show White Marlin Open and Jeep Week

Here's what to put on the calendar, in date order.

Memorial Day Weekend, May 22 through 25. The unofficial kickoff. Beaches open, boardwalk humming, restaurants and attractions in full swing. We covered this one in detail in our Memorial Day Weekend in Ocean City MD 2026 guide.

OC Jeep Week, May 28 through 31. The original Jeep Week, founded in 2010, returns to the Inlet Parking Lot. Daily Jeep parades, sand obstacle course on the beach, vendors, show and shine. Spectator admission is free. Expect concentrated downtown activity and busier inlet traffic those four days.

OC Air Show, June 13 and 14. This one is genuinely special. The U.S. Air Force Thunderbirds headline, and the French Air and Space Force has chosen the OC Air Show to kick off the Patrouille de France's "Liberté 250" U.S. tour celebrating America's 250th birthday. Red, white, and blue smoke from both teams over the beach between roughly 12th and 17th Streets. Best free seats are anywhere on the sand from the Inlet to 30th Street.

July 4 Fireworks: Two Locations for America's 250th. For the 250th anniversary, the town is staging two simultaneous celebrations:

  • Downtown at North Division Street: The Broken Hearts (Tom Petty tribute band) at 6 PM, live speed painter Jessica K Haas at 7 PM, Real Diamond (Neil Diamond tribute band) at 8 PM, fireworks at 9:30 PM.
  • Uptown at Northside Park (125th and Bay): DJ BK and Radio Ocean City at 8 PM, fireworks at 9:30 PM.

Plan transit early. Both areas will be congested by 7 PM and traffic clears slowly after the shows.

White Marlin Open, August 3 through 8. The 53rd annual White Marlin Open, the world's largest billfishing tournament, debuts a new six day format this year. Boats can now fish three out of six days, giving captains flexibility around offshore weather. Free public weigh ins happen daily at Harbour Island Marina, 14th Street and the bay, typically from 4 PM through 9:15 PM. Marlin Fest runs alongside on the beach at the Inlet, 11 AM to 9 PM with live music, food, and the live weigh in stream. Watching a multi million dollar fish hit the scale in person is a singular Ocean City experience.

OC Jeep Fest, August 25 through 30. Separate event from May's Jeep Week. Centered around 40th Street and the Convention Center, six days of Jeep culture, vendor village, daily beach crawls, and Show and Shine competitions.

OC Rock-n-Ride / BikeFest, September 9 through 13. Formerly Bike Week. Coincides with Delmarva Bike Week and brings well over 100,000 riders to the lower Eastern Shore. Two vendor villages at the Inlet and the Convention Center, daily live music, and the kind of late summer energy that signals the season is shifting.


Weekly Free Family Traditions

Free family events in Ocean City MD summer 2026 Sundaes in the Park Movies on the Beach Thursday Night Fireworks

Three free family events run weekly through summer:

Sundaes in the Park

When: Sundays, June 7 through August 30, 7 to 9 PM
Where: Northside Park, 127th Street and the Bay

Free family concert series at Northside Park with live music, free kids' activities, ice cream available for purchase, and sunset over Assawoman Bay. Stick around afterward for fireworks. The 2026 lineup spans Neil Diamond and Stevie Nicks tribute bands, 80s and 90s party music, blues, dance, and classic rock cover bands. Bring a picnic, beach chairs, and let the kids run.

Movies on the Beach

Family friendly films projected onto a giant beach screen at the 27th Street and Dorchester Street beaches, weekly through summer. Pack a blanket, snacks, and sweatshirts. Free.

Thursday Night Fireworks

Free weekly fireworks shows from the beach at Northside Park on Thursday evenings during peak summer. Combined with sunset over the bay, it's one of the most underrated free experiences in OC.


Practical 2026 Update: Getting Around

Ocean City MD boardwalk and Coastal Highway transportation options summer 2026

One important change for visitors this summer: the Boardwalk tram is closed. The town is exploring alternatives but no replacement has been announced for 2026.

Practical options for moving between the south end of the boardwalk and your hotel or condo:

  • Walk or bike: The boardwalk runs roughly 2.9 miles from the Inlet to 27th Street. Easy on foot or on your bike, which you can ride on the boardwalk from 2 AM to noon during the summer season. Bike rentals are available from our friends at Bike World.
  • Coastal Highway bus: Runs the length of the island, north and south. Day passes are inexpensive and a reliable backup for hot afternoons or post fireworks returns.
  • Rideshare: Uber and Lyft both operate in OC. Expect surge pricing on Friday and Saturday nights and after major events.
  • Boardwalk bikes: Allowed on the boardwalk during posted morning hours.

For a full orientation, ococean.com's getting around page is the official town resource.


Looking Past Summer: Fall Festival Season

Ocean City MD fall festival season Oceans Calling Country Calling Endless Summer Cruisin Sunfest 2026

If your travel window extends past Labor Day, the fall festival lineup is worth knowing about:

  • Oceans Calling Festival, September 25 through 27. Dave Matthews Band, Twenty One Pilots, and Mumford and Sons headline this three day event at the Inlet, fourth annual.
  • Country Calling Festival, October 2 and 3. Lainey Wilson, Rascal Flatts, Chris Stapleton, and Miranda Lambert lead the third annual country counterpart.
  • Endless Summer Cruisin', October 8 through 11. The 29th annual fall classic car show.
  • Sunfest, October 22 through 25. Free four day arts, crafts, music, and food festival marking its 50th anniversary at the Inlet.

September through October has become its own peak season in Ocean City. Warmer ocean water than people expect, lighter crowds during the week, and back to back festival weekends. If you're curious about life here beyond peak summer, our guide on what it's like to live in Ocean City year round is a good starting point.


If This Lifestyle Appeals to You

Ocean City MD oceanfront condo buyers exploring lifestyle and investment opportunities summer 2026

A lot of our clients started as seasonal vacationers. They visited OC for a long weekend, returned for a full week the next year, started bringing extended family, and eventually realized that this was a place worth owning.

Buying in Ocean City is much different than vacationing here. Before buying, owners have to evaluate the potential of future rental income, they have to weigh the values and benefits of potential buildings and associations, which specific building or area of town do they want to be in, and a list of other decisions that can make this a truly great (or not so great) investment.

What's important is, these are all things buyers don't know that they don't know. So if any of you are thinking about the possibility of taking that next step toward buying, here are two good places to start: what it's like to live in Ocean City and our complete guide to buying a condo here.

If rental income is a meaningful part of your decision, two more reads worth your time: how to maximize your Ocean City vacation rental income, and our take on who we trust with our clients' rental properties.

When you're ready to talk specifics, Grant Fritschle and Jon Barker are here to help. No pressure, no script, just honest conversation about whether the math works for your situation. You can also see what's currently available on our featured Ocean City listings page.


FAQ

Ocean City MD Summer 2026 frequently asked questions

What's new in Ocean City MD for Summer 2026?

Three new openings this season: Brasa restaurant at 33rd Street (Argentine and Italian, opening soon), Surfin' Bettys Burger Bar's second location at 127th Street, and The Core Club's first Heated Sculpt and Barre Studio with a café and juice bar at 81st Street. The Boardwalk tram is closed this summer.

Is the Ocean City boardwalk tram running in 2026?

No. The Boardwalk tram is closed for the 2026 season. The town is evaluating alternatives but no replacement service has been announced. Visitors should plan to walk, bike, ride the Coastal Highway bus, or use rideshare.

When is the OC Air Show in 2026?

The OC Air Show runs June 13 and 14, 2026. The U.S. Air Force Thunderbirds headline alongside France's Patrouille de France, who chose Ocean City to kick off their Liberté 250 U.S. tour celebrating America's 250th birthday.

What are the biggest events in Ocean City this summer?

The major summer events are OC Jeep Week (May 28 to 31), the OC Air Show (June 13 to 14), July 4 fireworks at two locations, the White Marlin Open in its new six day format (August 3 to 8), OC Jeep Fest (August 25 to 30), and OC Rock-n-Ride (September 9 to 13).

What new restaurants are open in Ocean City for 2026?

For genuinely new openings: Brasa (33rd Street, opening soon), Surfin' Bettys at 127th Street (open), and The Core Club's café and juice bar at 81st Street (open). Newer spots worth trying if you haven't been recently: Oyster and Scales on Dorchester Street, Jolly Jellyfish Beach Club at 98th Street, and Seacrets Hideaway at 5005 Coastal Highway.

Are there free family activities in Ocean City this summer?

Yes. Sundaes in the Park runs Sundays from June 7 through August 30 at Northside Park with free concerts, kids activities, and fireworks. Movies on the Beach runs weekly at multiple beach locations. Thursday Night Fireworks happen from the beach at Northside Park during peak summer. All free.


Why You Can Trust This Guide

This guide is produced by Grant Fritschle and The Fritschle Barker Group at Keller Williams Realty of Delmarva. Grant is a second-generation, lifelong Ocean City Realtor with 29+ years of experience in our coastal market and over 2,000 personal transactions. He grew up in Ocean City, was raised in the real estate business by his father Mark Fritschle, and co-founded The Fritschle Barker Group with Jon Barker after the successful new-construction sell-out of all 196 residences at The Gateway Grand, Ocean City's premier luxury condominium.

Grant is also Owner/Broker at Central Reservations, a vacation rental management company serving the Ocean City market since 1978, giving our team a unique dual perspective on the sales side AND the rental side of coastal real estate. The team maintains a 5.0 star average across 109 Google reviews.

This Summer 2026 guide reflects what we hear weekly from clients planning visits, looking at second homes, and evaluating Ocean City as a long term investment. All event dates, restaurant openings, and 2026-specific changes were verified against official sources before publication.

Questions? Call Grant directly at 410-430-5880 or contact our team.

Best Realtors in Ocean City MD

Your Top Ocean City, MD Real Estate Agents

Today, they are recognized nationally as a top-performing group of charismatic, skilled Agents deeply connected to the vibrant towns of the Eastern Shore. More than agents, they are trusted advisors and community advocates, blending local knowledge with national strategy to deliver exceptional results.

The Fritschle Barker Group at Keller Williams Realty of Delmarva adheres to all Fair Housing Act guidelines and NAR ethical standards.

May 14, 2026

The Complete Guide to Buying a Condo in Ocean City, MD

Oceanfront condo buildings along the Ocean City Maryland skyline - The Complete Guide to Buying a Condo in Ocean City MD by The Fritschle Barker Group

The Complete Guide to Buying a Condo in Ocean City, MD

Ocean City, MD is one of the most active condo real estate markets on the East Coast. Over the last six months, more than 500 condos changed hands in the town of Ocean City and West Ocean City alone, at prices ranging from under $200,000 to over $4 million. If you are thinking about buying a property here, the most important thing to know is that our resort-area market doesn't behave like other (more traditional) markets. Usually, our buyers don't 'have' to buy, and our sellers don't 'have' to sell. Prices can vary by building, by location, by unit-stack, and by height. What works as an advantage in one location might be a disadvantage in another. High or low condo fees can reflect a healthy, or an unhealthy Association. And rental income projections from listing sites are not always correct, and are oftentimes inflated.

This guide walks through every step of the process, the data behind it, and what most first-time buyers wish they had known before signing.


Quick Answer: Buying a Condo in Ocean City, MD

Buying a condo in Ocean City, MD requires evaluating location, building health, intended use, and potential rental income before making an offer.

Buying a condo in Ocean City typically begins with identifying a few expected key items, including your desired area (oceanfront, ocean block, bayside, or West OC), intended use, desired amount of bedrooms, and desired price range.

Moving past the obvious factors, we then start evaluating building-specific factors (HOA finances, reserves, condo fees, vacation rental policies), location and view considerations, securing the appropriate financing (conventional loans are most common, though about 30% of closed sales in the last six months were cash), and understanding rental income potential (if you plan to rent).

The median Ocean City condo sold for $460,000 in the last six months, with median condo fees around $468 per month. Working with an experienced local agent is critical because building-specific knowledge often determines whether a deal is a good one.


What the Ocean City Condo Market Looks Like in 2026

Here is what the data actually shows for closed condo sales in the last 180 days across Ocean City and West Ocean City:

Metric Value
Closed condo sales (last 180 days) 535
Median sale price $460,000
Median days on market 44
Median sale-to-list price ratio 97.3%
Active inventory 557 listings
Estimated months of supply ~6 months

A few things stand out:

  1. Inventory is balanced. Six months of supply is the textbook definition of a balanced market, neither a strong buyer's market nor a strong seller's market. That gives buyers more leverage than they had in 2021-2022, but not unlimited leverage.
  2. Properties sell close to asking but not at it. A median list-to-sale-price ratio of 97.3% means sellers are still pricing properties for the market. Lowball offers usually do not work in this market.
  3. Time on market varies dramatically by price tier. Median days on market for condos over $900,000 is 31 days. Median DOM for condos under $250,000 is 77 days. Our market is moving faster at the top.
The Ocean City condo market in 2026 is balanced, with about six months of supply, a median sale price of $460,000, and properties selling at 97.3% of asking price on average. Premium and luxury condos are moving faster than entry-level units.

Median Sale Price by Price Tier (Last 180 Days)

Price Tier Sales Median Sale Price Median DOM Sale-to-List
Under $250K 50 $230,000 77 days 95.4%
$250K-$400K 145 $315,000 57 days 97.5%
$400K-$600K 198 $480,000 36 days 97.4%
$600K-$900K 99 $675,000 39 days 97.1%
$900K-$1.5M 35 $1,100,000 31 days 98.3%
$1.5M+ 8 $1,997,000 6 days 97.3%

For deeper market data, see: Ocean City MD Real Estate Market Trends.


Where Should You Buy an Ocean City Condo?

Ocean City breaks into a handful of distinct zones, each with a different vibe, price profile, and buyer fit. Here is how closed condo sales distributed across them in the last six months:

Area Closed Condo Sales (180 days)
Bayside Interior 130
Bayside Waterfront 115
Direct Oceanfront 106
Ocean Block 98
West Ocean City 52
Oceanfront (Indirect View) 34

Direct Oceanfront vs. Ocean Block vs. Bayfront: What's the Difference?

  • Direct Oceanfront: The building sits directly on the beach. Premium price, premium view, premium rental income potential. Higher condo fees, generally.
  • Ocean Block: The building is on the ocean side of Coastal Highway, but not directly on the sand. Significant price discount compared to direct oceanfront.
  • Bayfront / Bayside Waterfront: The building sits on the bay side, often with sunset views, boat slips, and a different lifestyle entirely. Generally less expensive than oceanfront, but waterfront-specific factors (canal depth, exposure, slip availability) matter a lot.
  • Bayside Interior: Off the water entirely, on the bay side of Coastal Highway. Most affordable end of the market, often the entry point for first-time beach buyers.
  • West Ocean City: Across the Rt. 50 bridge west of OC. Different price structure, more single-family-style developments, year-round community feel.

As you might expect, the data shows a clear water-view premium: condos with water views sold for a median of $485,000, while condos without water views sold for a median of $419,000.

Direct oceanfront condos in Ocean City command the highest prices and obtain the highest rental income, ocean block condos offer beach proximity at a discount, bayfront condos provide sunset views and water access at lower price points, and bayside interior condos are typically the most affordable entry point. The right area depends on lifestyle, usage, and rental plans.

How Much Are Condo Fees in Ocean City, MD?

Ocean City Maryland condo fees explained

Across closed sales in the last 180 days, the median monthly condo fee was $468, with a 25th to 75th percentile range of $333 to $638. But the spread is far wider in reality. Some buildings charge under $200 per month. Others charge well over $1,500 per month.

What drives the difference? Generally:

  • Buildings with fewer amenities tend to have lower fees
  • Larger buildings with pools, parking garages, fitness centers, and on-site staff have higher fees
  • Oceanfront high-rises generally have higher fees than ocean block low-rises
  • Buildings with strong reserve studies and capital reserves tend to have more stable and predictable fees
  • Buildings with deferred maintenance often have lower fees today but may face special assessments later
The median monthly condo fee in Ocean City, MD is around $468, but the range is wide. Smaller buildings can be under $200/month, while large oceanfront high-rises with full amenities can exceed $1,500/month. Always look at what the fee actually covers and the health of the building's reserves before buying.

What Should Condo Fees Cover?

A well-managed condo fee in Ocean City typically covers: master insurance on the building, exterior maintenance and roof, common area utilities and cleaning, pools and amenities, trash and recycling, management, and contributions to capital reserves. What it does not cover: your individual unit insurance (HO-6 policy), property taxes, and unit-specific utilities.

HOA Health and Reserve Studies

In 2022, Maryland passed HB 107, which requires condo associations to maintain reserve studies and adequate funding for major capital repairs. This was prompted in part by the Champlain Towers South collapse in Florida. For Ocean City buyers, this means:

  • Buildings should be able to produce a current reserve study on request
  • Buyers should review the building's most recent financials diligently
  • A building with strong reserves is safer; a building with weak reserves may face special assessments down the line

How Do People Pay for Ocean City Condos?

Of the 535 condo sales closed in the last six months, the financing breakdown was:

Financing Type Closed Sales Share
Conventional Loan 348 65%
Cash 158 30%
VA Loan 7 1%
Adjustable Rate Mortgage 3 <1%
FHA 2 <1%
Other 17 3%

Nearly one in three Ocean City condo purchases in the last six months was cash. That has real implications for buyers using financing, competing offers may include cash buyers, and sellers often weigh certainty of close alongside price.

About 65% of Ocean City condo purchases use conventional financing and 30% are cash. FHA and VA financing make up less than 2% combined. Cash competition is real in this market, especially in the under-$500K and over-$900K price tiers.

Special Financing Considerations for Condos

Condo financing differs from single-family financing in important ways. Lenders evaluate the building, not just the buyer. Common issues include:

  • Warrantable vs. non-warrantable buildings. Conventional lenders (Fannie Mae, Freddie Mac) require buildings to meet specific criteria. Buildings with too many rental units, too many investor-owned units, or inadequate reserves may be classified as non-warrantable.
  • Vacation rental status. Buildings with high rental activity are sometimes treated as condotels by lenders, which limits financing options and can increases rates.
  • HOA litigation and assessments. Pending lawsuits or recent special assessments can affect approval.
  • Down payment requirements. Second-home and investment condos generally require higher down payments (often 20%+) than primary residence purchases.

We almost always recommend talking to a lender with Ocean City condo experience early. We'll say it again... talk to a LOCAL lender early! A national mortgage broker who has never financed an OC building can run into surprises that a local lender would have anticipated.


Can an Ocean City Condo Pay for Itself?

Ocean City Maryland vacation rental income calculation

This is the question almost every buyer asks. The honest answer is: sometimes, but the numbers are usually less generous than some present them.

What the data shows. Of the 535 closed condo sales, 91 (17%) were listed as active vacation rentals at the time of sale. Those properties sold at a median of $468,500 versus $454,000 for non-rental properties, a small premium, suggesting the market is not heavily rewarding rental status with higher purchase prices.

What the data does not show is operating income. That is where most sellers' rental income claims fall apart. A property that grossed $40,000 last year does not net $40,000 to the owner. After management fees, turnover cleaning, repairs, condo fees, taxes, and insurance, it's very difficult to actually be in the green.

Our framing: If you can buy a condo where the rental income covers a meaningful portion of carrying costs, while still allowing you reasonable personal use, you are doing well. If you are counting on the rental income to make the property cash flow positive in year one, the math rarely works.

Vacation rental income on Ocean City condos can offset a significant portion of carrying costs, but rarely produces strong positive cash flow in year one - especially if a significant portion of the purchase is financed.

What Are the Steps to Buying a Condo in Ocean City, MD?

Steps to buying a condo in Ocean City Maryland

The general process for buying a condo in Ocean City follows a predictable path. Here is what it looks like end to end:

  1. Hire a coastal specialist. Building-specific knowledge is the difference between a good purchase and a regret. (More on this below.)
  2. Define your goals. Lifestyle priorities, usage plans, rental intentions, budget ceiling.
  3. Get pre-approved. Talk to a lender with Ocean City condo experience. Get a pre-approval letter that reflects realistic budget including condo fees, taxes, insurance, etc.
  4. Search and tour. Your agent should be filtering on more than just price and beds/baths. HOA health, rental policies, and location matter.
  5. Make an offer. Pricing strategy depends on the building, the unit, the time on market, and how many other offers are likely. A median sale-to-list ratio of 97.3% is the starting framework, but specific units can require very different strategies.
  6. Get under contract. Standard Maryland contracts include inspection periods, financing contingencies, and condo document review periods.
  7. Review condo documents. This is the step most buyers underestimate. The condo association's bylaws, financials, reserve study, rules, and meeting minutes all matter. Pay close attention.
  8. Inspection and resolution. Your inspector should know coastal buildings specifically, salt-air corrosion, balcony conditions, HVAC age, and shared system implications are all unique to beach condos.
  9. Final walkthrough and close. Confirm the property is in the condition agreed. Sign. Get the keys.
  10. The first 90 days. If renting, get set up with your rental company. Make a punch list of small upgrades or improvements.
The Ocean City condo buying process takes about 30-60 days from offer to close once you find the right property. Critical steps include pre-approval with a condo-experienced lender, careful review of HOA documents and reserve studies, and a coastal-specialized inspection.

Who Pays the Buyer's Agent?

Who pays the buyer agent in Ocean City Maryland

In Ocean City, Buyer Agent compensation is typically still paid by the seller through "Cooperative Compensation" arrangements between brokerages. As a buyer, you typically do not write a separate check to your agent.

That said, it is not universally true. Following the 2024 NAR settlement, buyer agent compensation is more visibly negotiated, and there are scenarios where a buyer may be asked to compensate their own agent in part or in full. The most common case is a property where the seller is offering low or no cooperative compensation. A reputable buyer agent will discuss compensation transparently and make you aware of a low seller compensation rate before you tour the property.

In Ocean City, buyer agents are usually paid by the seller through cooperative compensation between brokerages, though this is not guaranteed in every transaction. Following the 2024 NAR settlement, buyer agent compensation is now negotiated more transparently. A good buyer agent will explain compensation clearly before you tour any properties.

How Do I Find a Good Real Estate Agent in Ocean City?

How to find a real estate agent in Ocean City Maryland

In a market this building-driven, the agent you choose has an outsized impact on outcomes. A generalist agent from an inland market usually does not know which buildings have weak reserves, which stacks have the best light, which HOAs are well-run, or which neighborhoods have shifted in the last five years.

What to look for:

  • Coastal specialization (Ocean City is their primary market, not a side market)
  • A real transaction history in your property type and price range
  • Verifiable references and reviews from buyers (not just sellers)
  • Honest answers about buildings, including the ones they would not recommend
  • A team or solo agent setup that gives you fast response times

A newer agent operating inside an established coastal team can be an excellent choice, they have direct access to senior specialists, real building data, and mentorship on every deal. What does not work is a generalist with no coastal context, regardless of years in the business.

"Grant was an excellent buyer's agent. We just purchased our first OC condo and it was clear that he knew every building inside and out. He didn't just open the door for us to tour, he provided invaluable insight into the building itself and HOA at each stop." J.H., First-time OC condo buyer

What Mistakes Do First-Time Ocean City Condo Buyers Make?

Common mistakes Ocean City Maryland condo buyers make

After reviewing thousands of transactions, the most common first-time buyer mistakes in Ocean City show up again and again. We have written about these in depth, but the short list:

  1. Looking at price before lifestyle. People shop on Zillow before they have honestly asked themselves how they will use the property. The wrong building for $400K is a worse outcome than the right building for $500K, or $350K.
  2. Underestimating ongoing costs. Condo fees, taxes, insurance, utilities, reserve assessments, and maintenance add up. The mortgage is not the only carrying cost.
  3. Trusting rental income projections from sellers or listing sites. Gross income figures do not equal net cash flow. Always run conservative numbers.
  4. Skipping detailed HOA document review. The bylaws, financials, reserve study, and meeting minutes tell you what kind of building you are actually buying into.
  5. Using the wrong Agent. Experience matters!
The most common first-time Ocean City condo buyer mistakes are: prioritizing price over lifestyle fit, underestimating ongoing carrying costs, trusting unrealistic rental income projections, skipping HOA document review, and using the wrong Agent for the job.

Ocean City Condo Buying FAQ

Ocean City Maryland real estate frequently asked questions

How much does a condo in Ocean City, MD cost?

The median condo sale price in Ocean City over the last six months was $460,000, with sales ranging from under $200,000 to over $4 million. Entry-level condos (under $250K) generally sell for around $230,000, while condos in the $400K-$600K range make up the largest segment of the market.

Are condo fees in Ocean City expensive?

The median monthly condo fee in Ocean City is around $468. Smaller older buildings can be under $200/month, while large oceanfront high-rises with full amenities and active reserves can exceed $1,500/month. Always look at what the fee covers and the health of the building's reserves before buying.

Can I rent out my condo as a vacation rental?

It depends on the building's rules. Some Ocean City condos allow short-term vacation rentals (a few days at a time), others require minimum stays of a week or month, and a small number prohibit rentals entirely. Always confirm rental policies before making an offer.

How much do I need to put down on an Ocean City condo?

For a primary residence, conventional down payments can be as low as 5%. For a second home, 10-20% is typical. For an investment property, 20-25% is the most common minimum. Buildings classified as non-warrantable or condotels may require larger down payments.

Are Ocean City condos a good investment?

It depends on what you mean by investment. As a vacation property that produces some rental offset, many Ocean City condos work well. As a pure cash-flowing investment with no personal use, the math is tighter and most properties produce break-even or modestly negative cash flow in early years. Long-term appreciation has historically been steady but not spectacular.

What's the difference between oceanfront and ocean block?

Direct oceanfront buildings sit directly on the beach. Ocean block buildings are on the ocean side of Coastal Highway but not on the sand. Oceanfront commands a significant price and rental income premium. Ocean block offers beach proximity at a meaningful discount.

How long does the buying process take?

From accepted offer to closing, most Ocean City condo transactions take 30-60 days. Cash purchases can close in 2-3 weeks. Financed purchases usually need 4-6 weeks for appraisal, condo document review, and underwriting.

Do I need a real estate agent to buy an Ocean City condo?

Legally no, but in this market, building-specific knowledge is essential. A coastal specialist can save you from buying into a financially weak building, overpaying for the wrong floorplan, or missing important condo document red flags. In Ocean City, the agent typically does not cost the buyer anything out of pocket through standard cooperative compensation arrangements.


Buying a Condo in Ocean City: Let's Talk

If you are seriously considering an Ocean City condo, the next step is a conversation, not a listing search. The right starting point is a 30-minute call to clarify what you actually want, what your budget realistically supports, and what neighborhoods and buildings fit. No pressure, no obligation.

Start the Conversation Call us! Browse Ocean City Condos


Why You Can Trust This Guide

This guide is produced by Grant Fritschle and The Fritschle Barker Group at Keller Williams Realty of Delmarva. Grant is a second-generation, lifelong Ocean City Realtor with 29+ years of experience in our coastal market and over 2,000 personal transactions. He grew up in Ocean City, was raised in the real estate business by his father Mark Fritschle, and co-founded The Fritschle Barker Group with Jon Barker after the successful new-construction sell-out of all 196 residences at The Gateway Grand, Ocean City's premier luxury condominium.

Grant is also Owner/Broker at Central Reservations, a vacation rental management company serving the Ocean City market since 1978, giving our team a unique dual perspective on both the sales and rental sides of coastal real estate. The team maintains a 5.0 star average across 110 Google reviews.

All market data in this guide is sourced directly from Bright MLS and analyzed by our team. We do not rely on automated valuation models or third-party estimates.

Methodology note: Market data reflects all closed Ocean City and West Ocean City condo sales over $50,000 from the trailing 180 days as of May 2026, sourced directly from Bright MLS.

Questions? Call Grant directly at 410-430-5880 or contact our team.

Best Realtors in Ocean City MD

Your Top Ocean City, MD Real Estate Agents

Today, they are recognized nationally as a top-performing group of charismatic, skilled Agents deeply connected to the vibrant towns of the Eastern Shore. More than agents, they are trusted advisors and community advocates, blending local knowledge with national strategy to deliver exceptional results.

The Fritschle Barker Group at Keller Williams Realty of Delmarva adheres to all Fair Housing Act guidelines and NAR ethical standards.

May 6, 2026

Ocean City MD Real Estate Market Report | April 2026

Ocean City MD Real Estate Market Report April 2026 - Sales Data, Condo Prices, and Market Trends

Ocean City MD Real Estate Market Report | April 2026

For newer and more updated numbers, see our Ocean City MD May 2026 Real Estate Market Report!

April delivered exactly the kind of month we needed after March had hinted at it... Spring is here and our team is busier than the closed-sale numbers reveal on their own.

Ninety-eight properties closed in April 2026 across Ocean City and West Ocean City, essentially matching March's 97 closings and producing $46.0 million in total dollar volume. The median sold price came in at $426,450, down slightly from March's $445,000 but stable in the broader picture. Median days on market held firm at 34 days (virtually identical to March), confirming that "correctly" priced properties are still moving in 30-days+/-.

The honest piece of this month's data: April 2026 came in below April 2025's 118 closings, a 17% year-over-year drop in volume. Despite this change, we believe Pricing is the more important story. And prices are holding strong.

What's harder to see in April's closed numbers, is what's happening behind the scenes. Heading into May, 119 properties across Ocean City and West Ocean City went "pending", meaning a substantial wave of closings is set to occur in May. Our team is in active conversations with more buyers and sellers right now than at any point this year!

Whether you're browsing oceanfront condos for sale in Ocean City MD or considering a single-family home in West Ocean City, this report breaks down what actually happened last month, what it means, and where we see the market heading.

Data is sourced directly from Bright MLS and includes all closed sales over $50,000 within the Direct Oceanfront, Oceanfront Indirect View, Ocean Block, Bayside Interior, Bayside Waterfront, and West Ocean City MLS areas.


Quick Answer: How Is the Ocean City MD Real Estate Market in April 2026?

The Ocean City and West Ocean City real estate market in April 2026 closed 98 sales totaling $46.0 million, essentially matching March's 97 closings. The median sold price was $426,450, down 3.0% from April 2025's $439,475, while median days on market stayed at 34 days. The list-to-sale ratio held at 97.3%, and 19% of properties sold at or above asking. April closings came in 17% below April 2025's 118, a year-over-year decline in volume that reflects fewer luxury and high-end closings, not market-wide weakness. Heading into May, 119 properties are under contract or pending with agreements signed in April or later, indicating a strong wave of closings ahead.


April 2026 Market Snapshot

Ocean City MD real estate price trends and market snapshot April 2026

Here's where the Ocean City real estate market stands as of the end of April 2026, compared to last month and the same month last year.

Note: March 2026 figures shown here reflect a small upward revision from the originally published 91 sales / $48.0 million as late-reporting MLS data settled. The comparison below is apples-to-apples.

Metric Apr 2026 Mar 2026 MoM Change Apr 2025 YoY Change
Units Sold 98 97 +1.0% 118 -16.9%
Total Sold Volume $45,991,702 $50,670,100 -9.2% $55,184,135 -16.7%
Median Sold Price $426,450 $445,000 -4.2% $439,475 -3.0%
Average Sold Price $469,303 $522,372 -10.2% $467,662 +0.4%
Avg. Price Per Sq Ft $406 $464 -12.6% $433 -6.4%
Median Days on Market 34 34 0.0% 31 +9.7%
Avg. Days on Market 83 70 +18.6% 61 +36.5%
List-to-Sale Ratio 97.3% 97.1% +0.2 pts 97.6% -0.3 pts
Sold At/Above Asking 19 (19%) 26 (27%) - 32 (27%) -
Sold Below Asking 79 (81%) 71 (73%) - 86 (73%) -

Data source: Bright MLS. Includes Ocean City and West Ocean City closed sales over $50,000.

A few key points:

  • The MoM median price drop is product-mix shift, not price decline. Direct Oceanfront closings dropped from 16 in March to 12 in April, and the median within that segment fell from $544,500 to $407,000. Fewer high-end oceanfront sales pull the overall median down even when individual segments are stable.
  • Year-over-year, the median is off only 3.0% - a much cleaner read on stability versus decline.
  • The list-to-sale ratio at 97.3% is essentially identical to last April's 97.6%. Sellers who price correctly are getting close to their number. That message has been consistent every month this year.

Grant Fritschle, leader of The Fritschle Barker Group, sees it this way: "April was a strong month on the ground, even if the closed-sale headline doesn't fully show it. We're writing more contracts than we're closing right now, and that's the leading indicator that matters. The clients pricing at recent comparable sales in their building are getting under contract in weeks, not months. The ones still trying to reach for a number above the last comp are sitting."


The YoY Question: Why Volume Looks Soft

April 2026's 98 closings came in 17% below April 2025's 118. Three factors explain most of the gap:

  • Fewer luxury and high-end closings. April 2026 produced 7 closings in the $600K to $749K range versus 16 last April, and 14 in the $500K to $599K range versus 20.
  • Direct Oceanfront slowed. This segment closed 12 units in April 2026 versus 25 a year ago. April 2025 was an unusually strong month for direct oceanfront, and we're now comping against that strength. Pipeline data suggests several oceanfront closings are queued for May.
  • Spring 2025 was a stronger volume comp. Total Q2 2025 closings ran 18% above Q2 2024, making April 2025 a hard comp.

What's not behind the YoY decline is broad pricing weakness. Median price is off just 3.0% year-over-year, list-to-sale ratio is essentially identical, and median DOM at 34 days is nearly matching last April's 31. The market is moving through inventory at the same pace, just with fewer high-end transactions in this comp month.


Sub-Market Breakdown

Ocean City MD real estate sub-market breakdown by location April 2026


By MLS Location

Location Sales Median Price Avg $/Sq Ft Avg DOM
Direct Oceanfront 12 $407,000 $499 96 days
Oceanfront Indirect View 7 $515,000 $476 96 days
Ocean Block 21 $400,000 $421 78 days
Bayside Interior 27 $300,000 $382 100 days
Bayside Waterfront 18 $480,000 $455 68 days
West Ocean City 13 $490,000 $241 57 days

Key takeaways:

  • West Ocean City had its strongest month of the year at 13 closings versus just 6 in March. Single-family inventory drove activity, including two seven-figure sales (covered below). The lower price-per-square-foot reflects West OC's product mix - heavily single-family with larger square footage rather than condo. Faster average DOM at 57 days suggests well-priced West OC product is moving as fast as anywhere on the island.
  • Bayside Interior was the volume leader at 27 sales, continuing March's trend. The $300,000 median is down meaningfully from March's $384,000 and reflects a heavier weighting toward smaller, more affordable bayside product this month. This is the entry-point segment, and it remains the busiest by unit count.
  • Direct Oceanfront slowed to 12 sales at a $407,000 median - both off from March, reflecting a softer luxury-end month rather than weakness in the segment itself.
  • Bayside Waterfront held steady at 18 sales with a $480,000 median, in line with March.
  • Ocean Block produced 21 sales at a $400,000 median, up from March's 16. Some longer-running listings finally closed, pulling the segment's average DOM to 78 days even as transaction count rose.

By Street Location

Area Sales Median Price Avg Price
Downtown (1st-27th St) 6 $231,450 $339,983
Midtown (28th-93rd St) 31 $400,000 $433,734
North OC (94th St+) 48 $407,500 $455,962
West Ocean City 13 $490,000 $663,065

North OC continued to lead by volume with 48 of April's 98 sales, virtually unchanged from March's 49. Midtown produced 31 closings as the second most-active corridor. Downtown was quieter with just 6 closings, and its low median ($231,450) reflects a concentration of lower-priced bayside interior product. West Ocean City's 13 sales and $490,000 median speak to a deeper mix of single-family, townhome, and bayside product than what's available on the island.


What Sold by Price Range

Price Range Apr 2026 Apr 2025 Change
Under $200K 2 2 0
$200K - $299K 20 17 +3
$300K - $399K 19 25 -6
$400K - $499K 29 29 0
$500K - $599K 14 20 -6
$600K - $749K 7 16 -9
$750K - $999K 4 7 -3
$1M+ 3 2 +1
  • The $400K to $499K range tied the year-ago number at 29 sales, and the $200K to $299K range grew by 3 closings. Together those two brackets represented half of April's activity.
  • YoY softness is concentrated in the $500K to $749K range, down a combined 15 sales from April 2025. This is also where Direct Oceanfront product typically lands.
  • The $1M+ segment held its ground at 3 closings versus 2 last April, including two seven-figure sales in West Ocean City.

What Sold by Bedroom Count

Bedrooms Sales Median Sold Price
Studio 6 $213,000
1 Bedroom 18 $282,500
2 Bedroom 38 $405,000
3 Bedroom 24 $512,500
4 Bedroom 9 $575,000
5 Bedroom 3 $1,150,000
  • Two-bedroom condos remained the workhorse at 38 sales (39% of April's activity) at a $405,000 median, essentially flat with March's $402,000. They continue to be the sweet spot for vacation rental investors and second-home buyers.
  • Three-bedroom units produced 24 sales at a $512,500 median, down from March's $620,000. The shift reflects fewer high-end three-bedroom oceanfront closings rather than a price reset within the segment.
  • Studios at $213,000 median and 1BR at $282,500 median continue to deliver the most accessible entry points into Ocean City ownership.

Notable Sales in April 2026

Notable real estate sales in Ocean City MD April 2026

Every month has its standout transactions. Here are the ones that caught our attention:

9515 Harbor Lights Dr, Berlin (West Ocean City) - $2,000,000
5BR | Single-Family | 21 Days on Market
Top sale of the month. Closed at 96.4% of asking. Larger single-family WOC product continues to attract buyers wanting beach proximity without island density.

231 N Heron Dr, Ocean City - $1,994,000
4BR | Bayside Waterfront | 14 Days on Market
A standout in Heron Harbour. Listed at $2.2M, sold at $1.99M in 14 days. Patient pricing isn't required when product is priced realistically against current comps.

12369 Hidden Bay Dr, Berlin (West Ocean City) - $1,150,000
5BR | Single-Family | 31 Days on Market
Sold at full asking price in 31 days. Hidden Bay's bayfront single-family product fills a gap for buyers who want substantial square footage and water views.

14125-B Caine Stable Rd, Ocean City - $975,000
3BR | Sunset Harbour II | 4 Days on Market
The speed story of the month. Bayside waterfront unit, list to under contract in 4 days at 97.6% of asking. When pricing matches the most recent in-building comp, this is what happens.

6 Hidden Cove Way #5E, Ocean City (Sunset Island) - $600,000
3BR | 1 Day on Market | Sold over asking in a single day, closed $100 above list. A textbook example of the pricing-discipline message.


The Pipeline: What's Closing in May

This is the leading indicator that closed-sale headlines miss.

As of the last day of April, 119 Ocean City and West Ocean City properties were under contract or pending with agreements signed on April 1 or later - realistically positioned to close in May. The total active pipeline, including longer-running contracts that have stretched timelines, sits at 166 properties.

For context, May 2025 produced 100 closings. If even three-quarters of the May-positioned pipeline closes, we'll match or exceed that number. The data points to an active May closing month, and our team's day-to-day workload reinforces what the data says.

This is the reality on the ground that monthly closed-sale reports always lag. Buyers and sellers who decide in late April don't show up in any closed-sale report until June.


What This Means for Ocean City MD Home Sellers

Tips for home sellers in Ocean City MD spring 2026

If you're considering selling your Ocean City property in 2026, April's data reinforces the message we've shared all year:

  • Price at the last comparable sale in your building. This is the single most important pricing principle in the OC condo market right now. April sales that closed in 30 days or less were almost universally priced this way. Properties that closed at over 200 days on market were almost universally not.
  • Median DOM held at 34 days. Same as March. Properly priced properties are not sitting.
  • List-to-sale ratio of 97.3%. Sellers who price correctly are getting within 2.7% of list on average. Don't budget for above-asking. Budget for "at-asking, with a small concession."
  • 19% of April sales closed at or above asking. Down from March's 27%, but still meaningful. Properties achieving this share two characteristics: priced at or below the last in-building comp, and they hit the market clean and presentable.
  • Highlight rental income. Buyers continue to evaluate purchases as investments. Strong rental history through a reputable management company like Central Reservations should be front and center.

For more guidance, check out our guide on the top mistakes sellers make in Ocean City.


What This Means for Ocean City MD Home Buyers

Tips for home buyers in Ocean City MD spring 2026

If you're looking to buy real estate in Ocean City, MD, April's picture has clear signals:

  • You still have negotiating room, but stay realistic. 81% of properties sold below asking, slightly higher than March's 73%. The discount isn't deep - list-to-sale ratio of 97.3% means the average buyer negotiated about $11,000 off a $400,000 list price. Coming in at 90% of asking on a well-priced listing is not a strategy that's working.
  • Speed still matters on the right properties. 25 of April's 98 sales sold in 10 days or less - 26% of the month's transactions. If you're touring something that just hit the market and the price is in line with recent comps, don't wait the weekend to write an offer.
  • West Ocean City is having a moment. 13 closings, more than double March's 6. With West OC's lower property tax rate (about 0.93% versus OC's 1.37%) and the deeper single-family product mix, this segment is worth watching for buyers prioritizing tax efficiency or larger floor plans.
  • Bayside interior is the value play. At a $300,000 median with 27 sales, this segment is where the most accessible product lives - many in well-managed buildings with pools, elevators, and solid vacation rental programs.
  • Get pre-approved before you start looking. The Sunset Harbour II unit that sold in 4 days at $975K was not unusual. Prepared buyers have the edge.

Browse oceanfront condos for sale in Ocean City MD or read our full guide on how to buy a beach house that actually makes financial sense. Contact our team for a personalized consultation.


Market Outlook: What's Ahead

Based on April's data and the pipeline going into May:

  • May closings will be strong. 119 properties already under contract from April-or-later agreements, with a broader pipeline of 166. May is positioned to be a meaningful closed-sale month.
  • Pricing remains stable. Median off just 3% year-over-year, list-to-sale ratio virtually unchanged. Not a market correcting downward, a market that has found its level.
  • Inventory is growing seasonally. Spring brings more new listings, giving buyers more choice but requiring sellers to be sharper on pricing. Pricing at the last in-building comp matters more, not less, as inventory builds.
  • The luxury segment is the wildcard. April's volume drop was concentrated in the $500K to $749K range. Whether that segment reactivates in May and June will tell us a lot about where the market heads through summer.
  • This is not a market where sellers can set their price. That message hasn't changed. Pricing at the last comparable sale is the single most important variable. Sellers who internalize that are closing in 30 days; sellers who don't are sitting for 100+.

"We tell our clients the same thing every spring," says Grant Fritschle. "The market rewards preparation and realism. May's pipeline is the strongest we've seen so far this year, and the conversations we're having with buyers and sellers right now will show up in a few months, as June and July close. This activity level confirms what we're feeling... this market is active, it's pricing-disciplined, and it's rewarding the people who come in with a clear strategy."

For our full 2026 forecast, read: Should You Buy in Ocean City MD in 2026?


FAQs: Ocean City MD Real Estate Market April 2026

Frequently asked questions about Ocean City MD real estate

How is the Ocean City MD real estate market performing in spring 2026?

The Ocean City and West Ocean City real estate market closed 98 sales in April 2026, essentially matching March's 97 closings. Median sold price was $426,450, down 3.0% year-over-year. Median days on market held at 34 days, indicating that correctly priced properties continue to move at a healthy pace.

What is the median home price in Ocean City, MD right now?

The median sold price in Ocean City, MD for April 2026 was $426,450. Direct Oceanfront condos had a median of $407,000, while Bayside Waterfront properties came in at $480,000. West Ocean City single-family and condo product produced a $490,000 median. Browse homes and condos for sale in Ocean City.

Why was April 2026 volume lower than April 2025?

April 2025 produced 118 closings, an unusually strong month with 25 Direct Oceanfront sales alone. April 2026 produced 98 closings with only 12 Direct Oceanfront sales. The year-over-year decline reflects fewer luxury and high-end closings, not broad pricing weakness. Median price is down only 3.0% year-over-year, and list-to-sale ratio is virtually identical.

Are home prices dropping in Ocean City, MD?

No. The median sold price in April 2026 ($426,450) is down 3.0% from April 2025 ($439,475). The list-to-sale ratio at 97.3% is essentially unchanged year-over-year. Pricing has stabilized rather than declined.

Is now a good time to buy in Ocean City, MD?

April 2026 data suggests buyers have negotiating room (81% of properties sold below asking) while still facing an active market (median DOM at 34 days). With a strong pipeline of properties closing in May, prepared and pre-approved buyers are well-positioned. Read our full guide: Should You Buy in Ocean City MD in 2026?

How long does it take to sell a property in Ocean City, MD?

The median days on market in April 2026 was 34 days, identical to March. West Ocean City moved fastest at 57 average days. Properties priced at recent comparable sales in their building tend to close within about a month.

What's the best area to buy in Ocean City, MD?

It depends on goals. Direct Oceanfront ($407,000 median in April) offers premium views and rental income. Bayside Waterfront ($480,000 median) offers bay views with strong rental performance. Bayside Interior ($300,000 median) is the most accessible entry point. West Ocean City offers a property tax advantage and deeper single-family inventory.


Client Testimonials

Grant Fritschle Ocean City MD Realtor Google Reviews

"Grant was an excellent buyer's agent. We just purchased our first OC condo and it was clear that he knew every building inside and out. He didn't just open the door for us to tour, he provided invaluable insight into the building itself and HOA at each stop. He was quick to respond, communicated clearly, and helped us find the place that was right for us. He also provided excellent contractor recommendations. We would definitely work with Grant again." -- Jesse H. (Google Review)

Check out more of Grant's Google reviews here!


Why You Can Trust This Report

This market report is produced by Grant Fritschle and The Fritschle Barker Group at Keller Williams Realty of Delmarva. Grant is a second-generation, lifelong Ocean City Realtor with nearly three decades of experience in our coastal market. He grew up in Ocean City, was raised in the real estate business by his father Mark Fritschle, and co-founded The Fritschle Barker Group with Jon Barker after the successful new construction sell-out of all 196 residences at The Gateway Grand, Ocean City's premier luxury condominium.

Grant is also Owner/Broker at Central Reservations, a vacation rental management company serving the Ocean City market since 1978, giving our team a unique dual perspective on both the sales and rental sides of coastal real estate.

All data in this report is sourced directly from Bright MLS and analyzed by our team. We do not rely on automated valuation models or third-party estimates.

Methodology note: This report includes all closed sales over $50,000 in the Direct Oceanfront, Oceanfront Indirect View, Ocean Block, Bayside Interior, Bayside Waterfront, and West Ocean City MLS areas (areas 80 through 85). Properties with Berlin mailing addresses that fall within the West Ocean City MLS area are included in the West Ocean City segment, consistent with how Bright MLS classifies them geographically. March 2026 figures shown reflect a small upward revision from the originally published 91 sales / $48.0 million as late-reporting MLS data settled.

Questions? Call Grant directly at 410-430-5880 or contact our team!

Best Realtors in Ocean City MD

Your Top Ocean City, MD Real Estate Agents

Today, they are recognized nationally as a top-performing group of charismatic, skilled Agents deeply connected to the vibrant towns of the Eastern Shore. More than agents, they are trusted advisors and community advocates, blending local knowledge with national strategy to deliver exceptional results.

The Fritschle Barker Group at Keller Williams Realty of Delmarva adheres to all Fair Housing Act guidelines and NAR ethical standards.

May 1, 2026

How Property Taxes Work in Ocean City MD: What Buyers Should Know (2026)

Ocean City MD property tax guide 2026 by The Fritschle Barker Group

How Property Taxes Work in Ocean City MD: What Buyers Should Know (2026)

If you're shopping for a condo, townhome, or single-family home in Ocean City, MD, the property tax conversation is skipped over too often (or it shows up late in the process).

The goal of this blog is to give you all the information you need, in one neat bundle. Grant Fritschle (and his team at the Fritschle Barker Group) have spent nearly three decades specializing in resort real estate, and the property-tax piece is one of the most consistently misunderstood (and improperly explained) parts of the transaction. The good news: once you read this blog you'll have a solid foundation and clear understanding of Ocean City property taxes.

Quick Answer: Ocean City property taxes for fiscal year 2026 are made up of three different pieces: a State rate of $0.112 per $100 of assessed value, a Worcester County rate of $0.815, and a town of Ocean City rate of $0.4426, totaling roughly $1.37 per $100 of property value. In other words, for a property that is currently assessed at $400,000 the taxes work out to about $5,500 per year.

The Three Layers of an Ocean City Property Tax Bill

Quick Answer: Ocean City property taxes are broken down into three parts. A MD State portion, a Worcester County portion, and a town of Ocean City portion. These three parts create a statutory rate of roughly 1.37% of assessed value for 2026.

Important Fact: Most Maryland counties have just two layers (state and county). Ocean City adds a third because it's an incorporated town with its own budget and services.

Here's how the FY2026 rates stack up:

Tax Layer Rate (per $100 of assessed value) What it funds
State of Maryland $0.112 State operations, education funding
Worcester County $0.815 County services, schools, public safety, roads
Town of Ocean City $0.4426 Beach patrol, public works, police, fire, EMS, town operations
Combined total $1.3696  

A few notes most buyers don't realize until later:

  • Worcester County collects all three and writes one bill. You don't get separate invoices from the state and town.
  • Bills are mailed each July. Pay in July and you get a 0.5% discount on the county portion. Small, but real money on a $5,000 bill.
  • The fiscal year runs July 1 through June 30, not the calendar year.
  • Worcester County has the second lowest property tax rate of all 24 Maryland counties and the lowest local income tax rate.

Statutory Rate vs. What You'll Actually Pay

Quick Answer: Worcester County reassesses Ocean City properties every three years. When the new assessed value comes in higher, the increase is phased in equally over the three-year cycle, so most owners are taxed on a value below their current market value during years one and two of the cycle.

Here's the most consistently misunderstood part of how Ocean City property taxes work: the rate you see on the tax rolls and the assessed value the rate gets applied to are two different things, and the assessed value is usually a moving target.

Triennial Assessment

Worcester County reassesses every property on a three-year cycle. When the new assessed value comes in higher than the prior one, the increase is then phased in over the next three years. The taxable assessment steps up by one-third of the increased value each year for three years. Then it's re-assessed and the cycle starts over.

Here's how it works with a real example. Say a property was previously assessed at $100,000 and the new reassessment comes in at $200,000:

Year Taxable Assessed Value Tax Bill at 1.37%
Year 1 of cycle $133,333 (prior $100K + 1/3 of the $100K increase) $1,827
Year 2 of cycle $166,667 (prior $100K + 2/3 of the $100K increase) $2,283
Year 3 of cycle $200,000 (full new value) $2,740

After year three, the assessment locks at the new full value until the next three-year reassessment.

One useful detail: Decreased values are not phased in. If your property's assessed value drops at reassessment, you get the full reduction in year one.
What the data shows: In a review of approximately 5,000 Ocean City tax records for FY2026 conducted by The Fritschle Barker Group, the median effective tax rate (annual tax divided by current taxable assessed value) came in at 1.226%, close to the statutory 1.37%. Most properties in the dataset were sitting mid-cycle in their phase-in, which is why the effective rate read below the statutory rate. When measured against recent sale prices instead of assessed values, the median effective rate dropped to roughly 0.9%, because sale prices have outrun phased-in assessments in the current market.

How to Forecast Your Next Two Tax Bills

Quick Answer: To estimate your next two years of tax bills, you first need to determine which year of the three-year reassessment cycle the property is in and whether the assessment is still phasing up. The annual increase is roughly one-third of the gap between the prior assessed value and the current full value.

Most buyers ask "what are the taxes?" and stop looking beyond the current tax-bill. That's the wrong question if the property is in year one or year two of a phase-in. The better question is "what will my taxes be in years one, two, and three of ownership."

Pull the property card from Worcester County's online records. It will show the prior assessed value, the current full assessed value, and the phase-in schedule for the next two years. Apply the combined tax rate (roughly 1.37% in OC proper, 0.93% in West OC) to each year's phased-in value and you have a defensible forecast. The number that lands on your settlement statement is rarely the number you'll be paying two years from now.

A practical note: Properties are sometimes assessed above their current market value. If you're buying one of those, there is an appeal process through Worcester County, and it's likely worth your time.

How Tax Burden Differs Across Ocean City

Quick Answer: Annual property tax bills in Ocean City typically range from about $2,200 to over $10,000 depending on neighborhood and price point. The effective rate is consistent townwide, but the dollar amounts scale directly with property value.

We pulled all closed Ocean City sales from January 2025 through April 2026 and grouped them by zone. The table below shows the median sale price and median annual tax bill in each part of town:

Ocean City Zone Median Sale Price Median Annual Tax
Midtown OC (28th to 60th St) $381,000 $3,347
Far North OC (131st St+) $400,000 $3,538
North OC (91st to 130th St) $440,000 $3,911
Downtown OC (1st to 27th St) $513,500 $4,192
Uptown OC (61st to 90th St) $520,000 $5,151
Boardwalk/Downtown South $578,750 $5,371

A few takeaways:

  • The effective tax rate is consistent across all of Ocean City. You're not paying a higher rate uptown vs. downtown. You're just buying at a different price point.
  • Buildings with elevated assessed values, typically newer luxury construction like Gateway Grand, Meridian, and Belmont Towers, produce higher annual bills, but their effective rate matches everyone else's.
  • For more on how building selection affects your total cost of ownership, see our guide to choosing the right condo building in Ocean City.

The West Ocean City Tax Advantage

Quick Answer: West Ocean City properties don't have to pay the Town of Ocean City tax, leaving them with only the state and county portions. The result is an effective rate of roughly 0.93%, versus 1.37% for properties on the island of Ocean City.

This is one of the most overlooked financial differences in the OC market. Cross the Route 50 bridge and a buyer goes from a roughly 1.37% statutory rate to a roughly 0.93% rate on the same assessed value.

In dollars: a $500,000 home in Ocean City proper pays roughly $6,850/year in property taxes. The same $500,000 home in West Ocean City pays roughly $4,635/year, a savings of about $2,200 per year, or $66,000 over a 30-year hold.

A few important caveats:

  • Some pockets of far North Ocean City on the bayside also fall outside the town limits and follow the same lower-rate structure. These properties are rare but they exist. Your agent should know which they are.
  • Lower property taxes do not mean lower HOA or condo fees. Those are separate and are governed by your building. See our condo fees guide for the full picture there.

Maryland's Nonresident Withholding Tax (Now 8.75% as of 2026)

Quick Answer: This is not an annual property tax. It's often called a sales-tax or exit-tax, but in reality it's an income tax. The State of Maryland charges non-resident property owners this tax when they sell their Maryland based property. As of January 1, 2026, Maryland increased the nonresident withholding tax to 8.75% for individual sellers and 8.25% for entities. This is collected at closing on real estate sold by anyone who isn't a Maryland resident. You only have to pay this tax on total proceeds/profits, and should work with an accountant to make sure the appropriate amount is being collected.

If you're actively buying a beach-house, this might not be at the top of your mind. But if you ever sell, it's something we want you to be aware of, so you can plan for it, and you can properly minimize any taxes paid.

Maryland requires a withholding payment at the closing of any real estate sale where the seller is not a Maryland resident. It's not technically a tax. It's an estimated prepayment toward any income tax the seller owes on the gain. But functionally, it's a chunk of cash that gets held back at settlement.

The 2026 update most articles haven't caught: effective January 1, 2026, the rate jumped from 8% to 8.75% for individual nonresident sellers and remains at 8.25% for nonresident entities.

Here's how it actually plays out:

  • The withholding is calculated on net proceeds (sale price minus mortgage payoff and reasonable closing costs), not the gross sale price.
  • Sellers can apply for a partial or full exemption from the Maryland Comptroller, but the application has to be submitted at least 21 days before closing. Miss that window and the full withholding gets collected at the table. The seller can apply for a refund afterward, but it takes 60+ days.
  • If the property had multiple owners and only one was a nonresident, the withholding only applies to that owner's share.
  • The withholding is not an additional tax. The seller will reconcile the actual tax owed when they file their Maryland nonresident return; whatever was over-withheld gets refunded.

If you're working with our team and live out of state, we'll help you get everything you need and get in touch with applicable experts early, usually at the time we go under contract, so you're not surprised at the closing table.

The Homestead Tax Credit and Who Qualifies

Quick Answer: The Maryland Homestead Tax Credit caps how much a property's taxable assessment can rise each year for primary residents only. In Ocean City, that cap is set at 0%, meaning eligible primary residents see no annual increase in their taxable assessment.

If you're buying a primary residence in Ocean City, meaning you actually live there at least six months of the year, not a vacation home or rental, you should know about the Homestead Tax Credit.

The state caps the year-over-year increase in your taxable assessment at a percentage set by each jurisdiction. In Ocean City, that cap is 0% for primary residents who file the homestead application. For Worcester County (covering West Ocean City and other unincorporated areas), the cap was historically 3% but was approved to drop to 0%.

Practical points:

  • You have to apply. The credit isn't automatic. Maryland's SDAT processes the application.
  • It only applies to owner-occupied primary residences. Vacation homes, second homes, and investment rentals don't qualify.
  • If you're buying a property as a future primary residence (planning to retire to OC), you can apply once you've moved in.
  • The credit can save real money over time, especially when assessments are climbing.

How and When to Appeal Your Assessment

Quick Answer: Maryland property owners can appeal their assessment within 45 days of receiving the assessment notice, or within 60 days of purchase if the new owner believes the assessed value exceeds market value.

Maryland's Department of Assessments and Taxation (SDAT) sends assessment notices in late December for the upcoming tax year. If you think your property is overvalued, you have a window to appeal:

  • Annual appeal window: Within 45 days of the assessment notice (typically late December through mid-February).
  • New owner appeal: Within 60 days of your closing date, you can file a "Petition for Review" if you believe the assessment exceeds the price you just paid.

Grounds for appeal generally come down to comparable sales evidence. If similar units in your building sold for less than your assessment, that's the case to make. Photos of property condition, evidence of needed repairs, and recent appraisals can all support a petition.

We've helped clients appeal successfully, particularly buyers who picked up properties at well-negotiated prices that came in below the prior assessment. The data we pulled for this guide showed roughly 9% of recent sales closed at prices below their current assessment, which represents a real appeal opportunity.

FAQs: Ocean City MD Property Taxes

When are property taxes due in Ocean City?

Tax bills are mailed in July. Payment is technically due by September 30 to avoid interest, but paying in July earns a 0.5% discount on the county portion.

Are Ocean City property taxes higher or lower than other Maryland beach towns?

Ocean City's combined rate is roughly 1.37%, which is moderate for Maryland. Worcester County itself has the second-lowest county rate in the state. Most of the rate stack comes from the town portion, which funds the resort-specific services.

How much will my Ocean City condo's taxes go up after I buy?

It depends on where the property sits in Worcester County's three-year reassessment cycle. If the property's assessment is still phasing up, your taxable value (and your bill) will step up by roughly one-third of the remaining increase each year until it catches up to the full assessed value. If the property is already at its full assessed value, the bill should stay relatively flat until the next reassessment. Ask your agent to pull the phase-in schedule from the Worcester County property card during your offer prep.

Are property taxes deductible on my federal return?

For most taxpayers, yes, though the federal SALT deduction does have a cap. Talk to your accountant about your specific situation; we are not tax advisors.

What's the property tax difference between Ocean City and Ocean Pines?

Ocean Pines is in unincorporated Worcester County, so there's no town tax, just state and county for a roughly 0.93% rate. Ocean Pines also has its own homeowners association assessment, which is separate from property tax but should be factored into your total cost of ownership.

Questions To Answer Before You Write an Offer

A short pre-offer checklist that we walk every buyer through:

  1. What's the current assessed value vs. the asking price? This tells you whether the listed tax bill reflects a phased-in assessment or current market value.
  2. Where in the three-year phase-in cycle is this property? This is how you forecast years one, two, and three of your tax bills, not just year one.
  3. What does the most recent tax bill actually show? Not the listing-quoted estimate. The real number from the Worcester County treasurer.
  4. Is the property in OC proper or unincorporated? Confirms whether the town portion applies.
  5. Has there been a recent renovation or addition? That can trigger a reassessment outside the normal cycle.

"He took plenty of time to find out what we were looking for, did not rush us, used his years of local experience to guide us to a great condo in a financially sound and well managed building, helped us through the nuances of buying real estate in Ocean City..."

S.M., Ocean City Condo Buyer (Google Review on Grants Google Business Profile)

Why You Can Trust This Guide

The Fritschle Barker Group has closed thousands of Ocean City transactions across two decades. Grant Fritschle is a second-generation Ocean City Realtor who grew up in the market; Jon Barker co-founded the team after the new-construction sell-out of the 196-residence Gateway Grand. Grant also serves as Owner/Broker of Central Reservations, which has managed Ocean City vacation rentals since 1978.

Methodology: The data referenced in this guide is drawn from a review of approximately 5,000 Ocean City property tax records and all closed Ocean City sales from January 2025 through April 2026. Tax rates and the nonresident withholding rate are current as of the publication date and were verified against Worcester County and Maryland Comptroller sources.

This article is informational and is not tax, legal, or financial advice. Always consult your accountant or attorney for your specific situation.

Best Realtors in Ocean City MD

Your Top Ocean City, MD Real Estate Agents

Today, they are recognized nationally as a top-performing group of charismatic, skilled Agents deeply connected to the vibrant towns of the Eastern Shore. More than agents, they are trusted advisors and community advocates, blending local knowledge with national strategy to deliver exceptional results.