Ocean City MD Real Estate Market Report | April 2026
For newer and more updated numbers, see our Ocean City MD May 2026 Real Estate Market Report!
April delivered exactly the kind of month we needed after March had hinted at it... Spring is here and our team is busier than the closed-sale numbers reveal on their own.
Ninety-eight properties closed in April 2026 across Ocean City and West Ocean City, essentially matching March's 97 closings and producing $46.0 million in total dollar volume. The median sold price came in at $426,450, down slightly from March's $445,000 but stable in the broader picture. Median days on market held firm at 34 days (virtually identical to March), confirming that "correctly" priced properties are still moving in 30-days+/-.
The honest piece of this month's data: April 2026 came in below April 2025's 118 closings, a 17% year-over-year drop in volume. Despite this change, we believe Pricing is the more important story. And prices are holding strong.
What's harder to see in April's closed numbers, is what's happening behind the scenes. Heading into May, 119 properties across Ocean City and West Ocean City went "pending", meaning a substantial wave of closings is set to occur in May. Our team is in active conversations with more buyers and sellers right now than at any point this year!
Whether you're browsing oceanfront condos for sale in Ocean City MD or considering a single-family home in West Ocean City, this report breaks down what actually happened last month, what it means, and where we see the market heading.
Data is sourced directly from Bright MLS and includes all closed sales over $50,000 within the Direct Oceanfront, Oceanfront Indirect View, Ocean Block, Bayside Interior, Bayside Waterfront, and West Ocean City MLS areas.
Jump To Section
- Quick Answer: How Is the Market?
- April 2026 Market Snapshot
- The YoY Question: Why Volume Looks Soft
- Sub-Market Breakdown
- What Sold by Price Range
- What Sold by Bedroom Count
- Notable Sales in April 2026
- The Pipeline: What's Closing in May
- What This Means for Sellers
- What This Means for Buyers
- Market Outlook: What's Ahead
- FAQs: Ocean City MD Real Estate Market
- Client Testimonials
- Why You Can Trust This Report
Quick Answer: How Is the Ocean City MD Real Estate Market in April 2026?
The Ocean City and West Ocean City real estate market in April 2026 closed 98 sales totaling $46.0 million, essentially matching March's 97 closings. The median sold price was $426,450, down 3.0% from April 2025's $439,475, while median days on market stayed at 34 days. The list-to-sale ratio held at 97.3%, and 19% of properties sold at or above asking. April closings came in 17% below April 2025's 118, a year-over-year decline in volume that reflects fewer luxury and high-end closings, not market-wide weakness. Heading into May, 119 properties are under contract or pending with agreements signed in April or later, indicating a strong wave of closings ahead.
April 2026 Market Snapshot

Here's where the Ocean City real estate market stands as of the end of April 2026, compared to last month and the same month last year.
Note: March 2026 figures shown here reflect a small upward revision from the originally published 91 sales / $48.0 million as late-reporting MLS data settled. The comparison below is apples-to-apples.
| Metric | Apr 2026 | Mar 2026 | MoM Change | Apr 2025 | YoY Change |
| Units Sold | 98 | 97 | +1.0% | 118 | -16.9% |
| Total Sold Volume | $45,991,702 | $50,670,100 | -9.2% | $55,184,135 | -16.7% |
| Median Sold Price | $426,450 | $445,000 | -4.2% | $439,475 | -3.0% |
| Average Sold Price | $469,303 | $522,372 | -10.2% | $467,662 | +0.4% |
| Avg. Price Per Sq Ft | $406 | $464 | -12.6% | $433 | -6.4% |
| Median Days on Market | 34 | 34 | 0.0% | 31 | +9.7% |
| Avg. Days on Market | 83 | 70 | +18.6% | 61 | +36.5% |
| List-to-Sale Ratio | 97.3% | 97.1% | +0.2 pts | 97.6% | -0.3 pts |
| Sold At/Above Asking | 19 (19%) | 26 (27%) | - | 32 (27%) | - |
| Sold Below Asking | 79 (81%) | 71 (73%) | - | 86 (73%) | - |
Data source: Bright MLS. Includes Ocean City and West Ocean City closed sales over $50,000.
A few key points:
- The MoM median price drop is product-mix shift, not price decline. Direct Oceanfront closings dropped from 16 in March to 12 in April, and the median within that segment fell from $544,500 to $407,000. Fewer high-end oceanfront sales pull the overall median down even when individual segments are stable.
- Year-over-year, the median is off only 3.0% - a much cleaner read on stability versus decline.
- The list-to-sale ratio at 97.3% is essentially identical to last April's 97.6%. Sellers who price correctly are getting close to their number. That message has been consistent every month this year.
Grant Fritschle, leader of The Fritschle Barker Group, sees it this way: "April was a strong month on the ground, even if the closed-sale headline doesn't fully show it. We're writing more contracts than we're closing right now, and that's the leading indicator that matters. The clients pricing at recent comparable sales in their building are getting under contract in weeks, not months. The ones still trying to reach for a number above the last comp are sitting."
The YoY Question: Why Volume Looks Soft
April 2026's 98 closings came in 17% below April 2025's 118. Three factors explain most of the gap:
- Fewer luxury and high-end closings. April 2026 produced 7 closings in the $600K to $749K range versus 16 last April, and 14 in the $500K to $599K range versus 20.
- Direct Oceanfront slowed. This segment closed 12 units in April 2026 versus 25 a year ago. April 2025 was an unusually strong month for direct oceanfront, and we're now comping against that strength. Pipeline data suggests several oceanfront closings are queued for May.
- Spring 2025 was a stronger volume comp. Total Q2 2025 closings ran 18% above Q2 2024, making April 2025 a hard comp.
What's not behind the YoY decline is broad pricing weakness. Median price is off just 3.0% year-over-year, list-to-sale ratio is essentially identical, and median DOM at 34 days is nearly matching last April's 31. The market is moving through inventory at the same pace, just with fewer high-end transactions in this comp month.
Sub-Market Breakdown

By MLS Location
| Location | Sales | Median Price | Avg $/Sq Ft | Avg DOM |
| Direct Oceanfront | 12 | $407,000 | $499 | 96 days |
| Oceanfront Indirect View | 7 | $515,000 | $476 | 96 days |
| Ocean Block | 21 | $400,000 | $421 | 78 days |
| Bayside Interior | 27 | $300,000 | $382 | 100 days |
| Bayside Waterfront | 18 | $480,000 | $455 | 68 days |
| West Ocean City | 13 | $490,000 | $241 | 57 days |
Key takeaways:
- West Ocean City had its strongest month of the year at 13 closings versus just 6 in March. Single-family inventory drove activity, including two seven-figure sales (covered below). The lower price-per-square-foot reflects West OC's product mix - heavily single-family with larger square footage rather than condo. Faster average DOM at 57 days suggests well-priced West OC product is moving as fast as anywhere on the island.
- Bayside Interior was the volume leader at 27 sales, continuing March's trend. The $300,000 median is down meaningfully from March's $384,000 and reflects a heavier weighting toward smaller, more affordable bayside product this month. This is the entry-point segment, and it remains the busiest by unit count.
- Direct Oceanfront slowed to 12 sales at a $407,000 median - both off from March, reflecting a softer luxury-end month rather than weakness in the segment itself.
- Bayside Waterfront held steady at 18 sales with a $480,000 median, in line with March.
- Ocean Block produced 21 sales at a $400,000 median, up from March's 16. Some longer-running listings finally closed, pulling the segment's average DOM to 78 days even as transaction count rose.
By Street Location
| Area | Sales | Median Price | Avg Price |
| Downtown (1st-27th St) | 6 | $231,450 | $339,983 |
| Midtown (28th-93rd St) | 31 | $400,000 | $433,734 |
| North OC (94th St+) | 48 | $407,500 | $455,962 |
| West Ocean City | 13 | $490,000 | $663,065 |
North OC continued to lead by volume with 48 of April's 98 sales, virtually unchanged from March's 49. Midtown produced 31 closings as the second most-active corridor. Downtown was quieter with just 6 closings, and its low median ($231,450) reflects a concentration of lower-priced bayside interior product. West Ocean City's 13 sales and $490,000 median speak to a deeper mix of single-family, townhome, and bayside product than what's available on the island.
What Sold by Price Range
| Price Range | Apr 2026 | Apr 2025 | Change |
| Under $200K | 2 | 2 | 0 |
| $200K - $299K | 20 | 17 | +3 |
| $300K - $399K | 19 | 25 | -6 |
| $400K - $499K | 29 | 29 | 0 |
| $500K - $599K | 14 | 20 | -6 |
| $600K - $749K | 7 | 16 | -9 |
| $750K - $999K | 4 | 7 | -3 |
| $1M+ | 3 | 2 | +1 |
- The $400K to $499K range tied the year-ago number at 29 sales, and the $200K to $299K range grew by 3 closings. Together those two brackets represented half of April's activity.
- YoY softness is concentrated in the $500K to $749K range, down a combined 15 sales from April 2025. This is also where Direct Oceanfront product typically lands.
- The $1M+ segment held its ground at 3 closings versus 2 last April, including two seven-figure sales in West Ocean City.
What Sold by Bedroom Count
| Bedrooms | Sales | Median Sold Price |
| Studio | 6 | $213,000 |
| 1 Bedroom | 18 | $282,500 |
| 2 Bedroom | 38 | $405,000 |
| 3 Bedroom | 24 | $512,500 |
| 4 Bedroom | 9 | $575,000 |
| 5 Bedroom | 3 | $1,150,000 |
- Two-bedroom condos remained the workhorse at 38 sales (39% of April's activity) at a $405,000 median, essentially flat with March's $402,000. They continue to be the sweet spot for vacation rental investors and second-home buyers.
- Three-bedroom units produced 24 sales at a $512,500 median, down from March's $620,000. The shift reflects fewer high-end three-bedroom oceanfront closings rather than a price reset within the segment.
- Studios at $213,000 median and 1BR at $282,500 median continue to deliver the most accessible entry points into Ocean City ownership.
Notable Sales in April 2026

Every month has its standout transactions. Here are the ones that caught our attention:
9515 Harbor Lights Dr, Berlin (West Ocean City) - $2,000,000
5BR | Single-Family | 21 Days on Market
Top sale of the month. Closed at 96.4% of asking. Larger single-family WOC product continues to attract buyers wanting beach proximity without island density.
231 N Heron Dr, Ocean City - $1,994,000
4BR | Bayside Waterfront | 14 Days on Market
A standout in Heron Harbour. Listed at $2.2M, sold at $1.99M in 14 days. Patient pricing isn't required when product is priced realistically against current comps.
12369 Hidden Bay Dr, Berlin (West Ocean City) - $1,150,000
5BR | Single-Family | 31 Days on Market
Sold at full asking price in 31 days. Hidden Bay's bayfront single-family product fills a gap for buyers who want substantial square footage and water views.
14125-B Caine Stable Rd, Ocean City - $975,000
3BR | Sunset Harbour II | 4 Days on Market
The speed story of the month. Bayside waterfront unit, list to under contract in 4 days at 97.6% of asking. When pricing matches the most recent in-building comp, this is what happens.
6 Hidden Cove Way #5E, Ocean City (Sunset Island) - $600,000
3BR | 1 Day on Market | Sold over asking in a single day, closed $100 above list. A textbook example of the pricing-discipline message.
The Pipeline: What's Closing in May
This is the leading indicator that closed-sale headlines miss.
As of the last day of April, 119 Ocean City and West Ocean City properties were under contract or pending with agreements signed on April 1 or later - realistically positioned to close in May. The total active pipeline, including longer-running contracts that have stretched timelines, sits at 166 properties.
For context, May 2025 produced 100 closings. If even three-quarters of the May-positioned pipeline closes, we'll match or exceed that number. The data points to an active May closing month, and our team's day-to-day workload reinforces what the data says.
This is the reality on the ground that monthly closed-sale reports always lag. Buyers and sellers who decide in late April don't show up in any closed-sale report until June.
What This Means for Ocean City MD Home Sellers

If you're considering selling your Ocean City property in 2026, April's data reinforces the message we've shared all year:
- Price at the last comparable sale in your building. This is the single most important pricing principle in the OC condo market right now. April sales that closed in 30 days or less were almost universally priced this way. Properties that closed at over 200 days on market were almost universally not.
- Median DOM held at 34 days. Same as March. Properly priced properties are not sitting.
- List-to-sale ratio of 97.3%. Sellers who price correctly are getting within 2.7% of list on average. Don't budget for above-asking. Budget for "at-asking, with a small concession."
- 19% of April sales closed at or above asking. Down from March's 27%, but still meaningful. Properties achieving this share two characteristics: priced at or below the last in-building comp, and they hit the market clean and presentable.
- Highlight rental income. Buyers continue to evaluate purchases as investments. Strong rental history through a reputable management company like Central Reservations should be front and center.
For more guidance, check out our guide on the top mistakes sellers make in Ocean City.
What This Means for Ocean City MD Home Buyers

If you're looking to buy real estate in Ocean City, MD, April's picture has clear signals:
- You still have negotiating room, but stay realistic. 81% of properties sold below asking, slightly higher than March's 73%. The discount isn't deep - list-to-sale ratio of 97.3% means the average buyer negotiated about $11,000 off a $400,000 list price. Coming in at 90% of asking on a well-priced listing is not a strategy that's working.
- Speed still matters on the right properties. 25 of April's 98 sales sold in 10 days or less - 26% of the month's transactions. If you're touring something that just hit the market and the price is in line with recent comps, don't wait the weekend to write an offer.
- West Ocean City is having a moment. 13 closings, more than double March's 6. With West OC's lower property tax rate (about 0.93% versus OC's 1.37%) and the deeper single-family product mix, this segment is worth watching for buyers prioritizing tax efficiency or larger floor plans.
- Bayside interior is the value play. At a $300,000 median with 27 sales, this segment is where the most accessible product lives - many in well-managed buildings with pools, elevators, and solid vacation rental programs.
- Get pre-approved before you start looking. The Sunset Harbour II unit that sold in 4 days at $975K was not unusual. Prepared buyers have the edge.
Browse oceanfront condos for sale in Ocean City MD or read our full guide on how to buy a beach house that actually makes financial sense. Contact our team for a personalized consultation.
Market Outlook: What's Ahead
Based on April's data and the pipeline going into May:
- May closings will be strong. 119 properties already under contract from April-or-later agreements, with a broader pipeline of 166. May is positioned to be a meaningful closed-sale month.
- Pricing remains stable. Median off just 3% year-over-year, list-to-sale ratio virtually unchanged. Not a market correcting downward, a market that has found its level.
- Inventory is growing seasonally. Spring brings more new listings, giving buyers more choice but requiring sellers to be sharper on pricing. Pricing at the last in-building comp matters more, not less, as inventory builds.
- The luxury segment is the wildcard. April's volume drop was concentrated in the $500K to $749K range. Whether that segment reactivates in May and June will tell us a lot about where the market heads through summer.
- This is not a market where sellers can set their price. That message hasn't changed. Pricing at the last comparable sale is the single most important variable. Sellers who internalize that are closing in 30 days; sellers who don't are sitting for 100+.
"We tell our clients the same thing every spring," says Grant Fritschle. "The market rewards preparation and realism. May's pipeline is the strongest we've seen so far this year, and the conversations we're having with buyers and sellers right now will show up in a few months, as June and July close. This activity level confirms what we're feeling... this market is active, it's pricing-disciplined, and it's rewarding the people who come in with a clear strategy."
For our full 2026 forecast, read: Should You Buy in Ocean City MD in 2026?
FAQs: Ocean City MD Real Estate Market April 2026

How is the Ocean City MD real estate market performing in spring 2026?
The Ocean City and West Ocean City real estate market closed 98 sales in April 2026, essentially matching March's 97 closings. Median sold price was $426,450, down 3.0% year-over-year. Median days on market held at 34 days, indicating that correctly priced properties continue to move at a healthy pace.
What is the median home price in Ocean City, MD right now?
The median sold price in Ocean City, MD for April 2026 was $426,450. Direct Oceanfront condos had a median of $407,000, while Bayside Waterfront properties came in at $480,000. West Ocean City single-family and condo product produced a $490,000 median. Browse homes and condos for sale in Ocean City.
Why was April 2026 volume lower than April 2025?
April 2025 produced 118 closings, an unusually strong month with 25 Direct Oceanfront sales alone. April 2026 produced 98 closings with only 12 Direct Oceanfront sales. The year-over-year decline reflects fewer luxury and high-end closings, not broad pricing weakness. Median price is down only 3.0% year-over-year, and list-to-sale ratio is virtually identical.
Are home prices dropping in Ocean City, MD?
No. The median sold price in April 2026 ($426,450) is down 3.0% from April 2025 ($439,475). The list-to-sale ratio at 97.3% is essentially unchanged year-over-year. Pricing has stabilized rather than declined.
Is now a good time to buy in Ocean City, MD?
April 2026 data suggests buyers have negotiating room (81% of properties sold below asking) while still facing an active market (median DOM at 34 days). With a strong pipeline of properties closing in May, prepared and pre-approved buyers are well-positioned. Read our full guide: Should You Buy in Ocean City MD in 2026?
How long does it take to sell a property in Ocean City, MD?
The median days on market in April 2026 was 34 days, identical to March. West Ocean City moved fastest at 57 average days. Properties priced at recent comparable sales in their building tend to close within about a month.
What's the best area to buy in Ocean City, MD?
It depends on goals. Direct Oceanfront ($407,000 median in April) offers premium views and rental income. Bayside Waterfront ($480,000 median) offers bay views with strong rental performance. Bayside Interior ($300,000 median) is the most accessible entry point. West Ocean City offers a property tax advantage and deeper single-family inventory.
Client Testimonials

"Grant was an excellent buyer's agent. We just purchased our first OC condo and it was clear that he knew every building inside and out. He didn't just open the door for us to tour, he provided invaluable insight into the building itself and HOA at each stop. He was quick to respond, communicated clearly, and helped us find the place that was right for us. He also provided excellent contractor recommendations. We would definitely work with Grant again." -- Jesse H. (Google Review)
Check out more of Grant's Google reviews here!
Why You Can Trust This Report
This market report is produced by Grant Fritschle and The Fritschle Barker Group at Keller Williams Realty of Delmarva. Grant is a second-generation, lifelong Ocean City Realtor with nearly three decades of experience in our coastal market. He grew up in Ocean City, was raised in the real estate business by his father Mark Fritschle, and co-founded The Fritschle Barker Group with Jon Barker after the successful new construction sell-out of all 196 residences at The Gateway Grand, Ocean City's premier luxury condominium.
Grant is also Owner/Broker at Central Reservations, a vacation rental management company serving the Ocean City market since 1978, giving our team a unique dual perspective on both the sales and rental sides of coastal real estate.
All data in this report is sourced directly from Bright MLS and analyzed by our team. We do not rely on automated valuation models or third-party estimates.
Methodology note: This report includes all closed sales over $50,000 in the Direct Oceanfront, Oceanfront Indirect View, Ocean Block, Bayside Interior, Bayside Waterfront, and West Ocean City MLS areas (areas 80 through 85). Properties with Berlin mailing addresses that fall within the West Ocean City MLS area are included in the West Ocean City segment, consistent with how Bright MLS classifies them geographically. March 2026 figures shown reflect a small upward revision from the originally published 91 sales / $48.0 million as late-reporting MLS data settled.
Questions? Call Grant directly at 410-430-5880 or contact our team!

Your Top Ocean City, MD Real Estate Agents
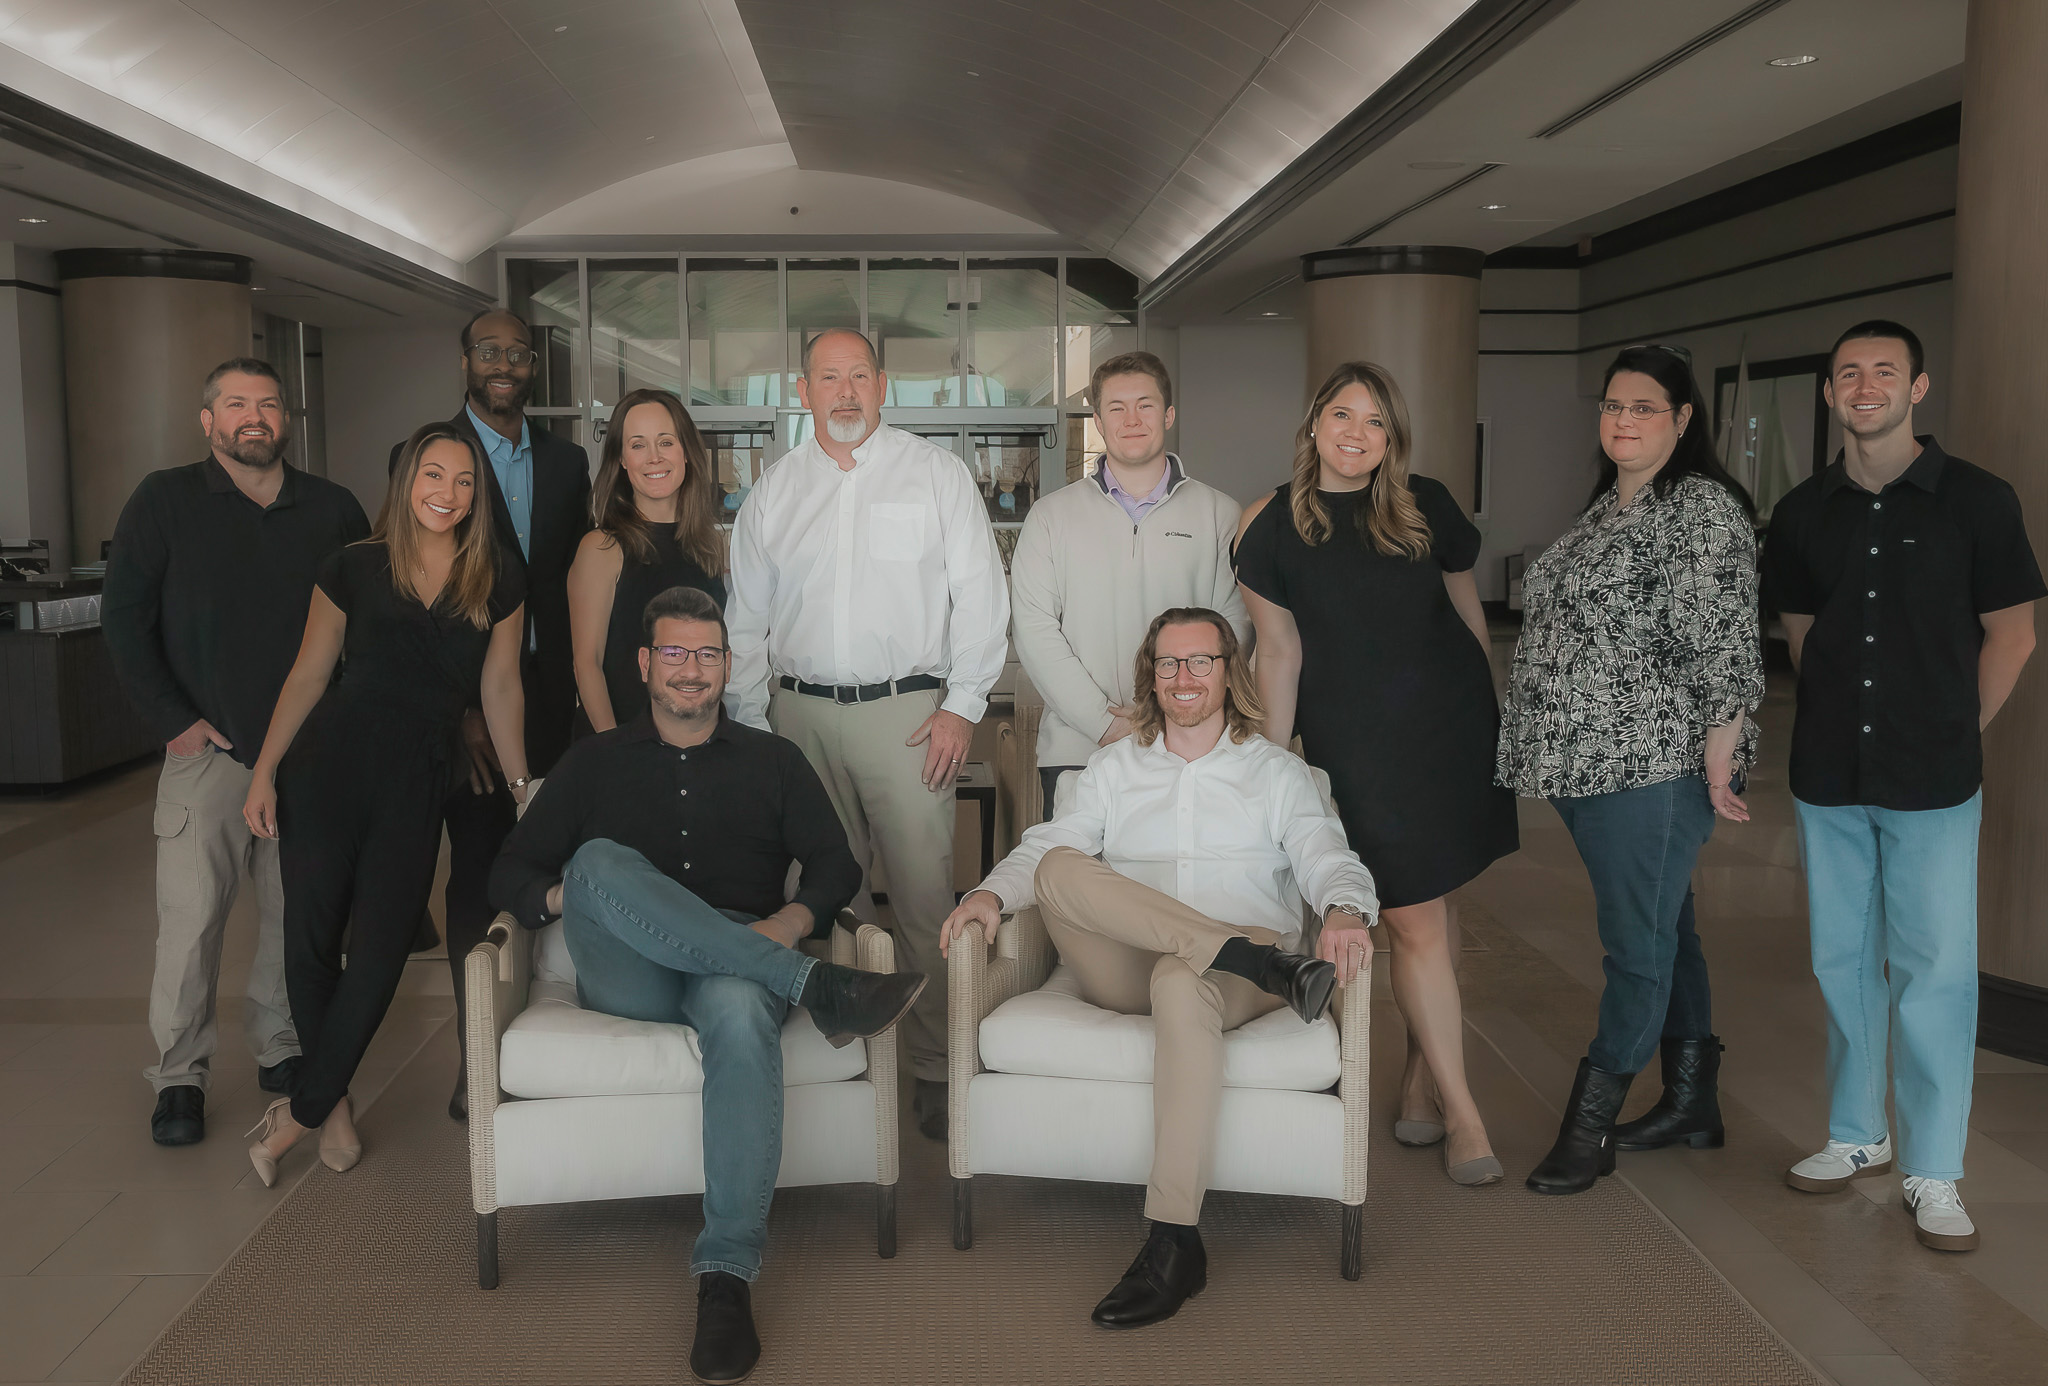
Today, they are recognized nationally as a top-performing group of charismatic, skilled Agents deeply connected to the vibrant towns of the Eastern Shore. More than agents, they are trusted advisors and community advocates, blending local knowledge with national strategy to deliver exceptional results.
The Fritschle Barker Group at Keller Williams Realty of Delmarva adheres to all Fair Housing Act guidelines and NAR ethical standards.