Ocean City MD Real Estate Market Report | May 2026
Last Updated: May 2026. Based on closed Bright MLS sales in the Direct Oceanfront, Oceanfront Indirect View, Ocean Block, Bayside Interior, Bayside Waterfront, and West Ocean City MLS areas (80 through 85), plus current active, pending, and under-contract inventory. For newer numbers, see the Ocean City MD June 2026 Real Estate Market Report.
Jump To Section
- Quick Answer & Key Takeaways
- Grant's Market Minute
- What Most People Will Miss
- May 2026 Market Snapshot
- What The Numbers Tell Us
- Sub-Market Breakdown
- Street Location Breakdown
- Price Range Analysis
- Bedroom Count Analysis
- Notable Sales From May
- Pending Sales & June Outlook
- Cash Buyers
- What This Means For Buyers
- What This Means For Sellers
- Frequently Asked Questions
- Market Outlook
- Why You Can Trust This Report
If All You Look At Is Inventory, You Might Think Buyers Have The Advantage
Inventory is the highest we've seen in this dataset.
Days on market are rising.
More sellers are competing for attention.
Buyers have more options than they did a year ago.
So naturally, you'd expect prices to be softening.
Except they're not.
Median prices climbed 6% year over year.
Price per square foot climbed 6% year over year.
Nearly one-third of buyers paid cash.
And properly priced properties continue to disappear from the market in days.
That's what makes the Ocean City real estate market so interesting right now.
The headlines suggest one story.
The actual data suggests another.
One thing I've been watching closely this spring is the growing gap between properties priced at the most recent comparable sale and properties trying to push beyond it. Buyers remain active. They're simply becoming more selective.
May reinforced that trend.
The market rewarded realistic sellers.
The market ignored unrealistic ones.
And as inventory continues to grow, that distinction is becoming more important, not less.
Quick Answer: How Is The Ocean City MD Real Estate Market In May 2026?
Key Takeaways
- May 2026 produced 117 closings, the strongest month of the year so far.
- Total sales volume reached $61.3 million.
- Median sold price increased 6.0% year over year to $445,000.
- Average price per square foot increased 6.0% to $421, confirming genuine appreciation.
- Inventory expanded to approximately 4.5 months of supply, creating more buyer choice.
- About 32% of buyers paid cash.
- 27% of all sales went under contract in 10 days or less.
- 168 properties were pending or under contract at month end, pointing toward another strong month ahead.
Quick Answer
The Ocean City and West Ocean City real estate market closed 117 sales in May 2026 totaling $61.3 million, making it the strongest month of the year so far and up from April's revised 102 closings.
The median sold price rose to $445,000, up 6.0% year over year and 4.3% month over month.
Average price per square foot climbed to $421, also up 6.0% year over year, confirming that the increase reflects actual market appreciation rather than a change in what happened to sell.
Inventory continued to build, pushing median days on market to 44 days and creating roughly 4.5 months of supply. Even so, well-priced properties continued to move quickly, with more than one-quarter of all sales going under contract within 10 days.
Perhaps most importantly, 168 properties remained under contract or pending at month end, suggesting the market's momentum is likely to continue into June.
Grant's Market Minute
Most people will look at this report and focus on one number.
The 117 sales.
Others will focus on the 6% increase in median price.
Both matter.
But neither is the most important story.
The most important story is that inventory is growing while prices continue to rise.
Normally, those two forces work against one another.
More inventory usually means more competition and slower appreciation.
Instead, we're seeing more listings, more buyer choice, and continued price strength.
That tells me demand remains healthier than many people realize.
Ocean City isn't experiencing the frenzy we saw during 2021 and 2022.
But we're also not seeing weakness.
We're seeing normalization.
And that's actually a very healthy place for a market to be.
What Most People Will Miss In These Numbers

Most market reports focus on what happened.
The better question is why it happened.
Here's what stands out to me:
Inventory is the deepest we've seen in our dataset.
Buyers have more options.
Days on market are increasing.
Yet prices continue to move higher.
That combination tells us something important.
Demand hasn't disappeared.
Buyers are simply becoming more disciplined.
They're willing to pay strong prices for properties that make sense.
They're much less willing to overpay for properties that don't.
That's why we're seeing such a dramatic difference between listings that are priced correctly and listings that are reaching beyond the most recent comparable sales.
The market isn't punishing sellers.
It's rewarding realism.
May 2026 Market Snapshot

Here's where the Ocean City and West Ocean City housing market stands as of the end of May 2026.
Important Note: April 2026 figures below reflect an upward revision from the originally reported 98 sales and $46.0 million in volume to 102 sales and $49.1 million after late-reporting Bright MLS data settled. May's figures may also increase slightly as additional sales are finalized and reported.
| Metric | May 2026 | Apr 2026 (Rev.) | MoM | May 2025 | YoY |
|---|---|---|---|---|---|
| Units Sold | 117 | 102 | +14.7% | 115 | +1.7% |
| Total Sold Volume | $61,312,100 | $49,094,837 | +24.9% | $57,259,080 | +7.1% |
| Median Sold Price | $445,000 | $426,450 | +4.3% | $420,000 | +6.0% |
| Average Sold Price | $524,035 | $481,322 | +8.9% | $497,905 | +5.2% |
| Avg Price Per Sq Ft | $421 | $408 | +3.2% | $397 | +6.0% |
| Median Days On Market | 44 | 34 | +10 days | 41 | +3 days |
| Average Days On Market | 76 | 82 | -7.3% | 71 | +7.0% |
| List-To-Sale Ratio | 97.9% | 97.5% | +0.4 pt | 97.7% | +0.2 pt |
| Sold At/Above Asking | 37 (32%) | 22 (22%) | n/a | 35 (30%) | n/a |
| Sold Below Asking | 80 (68%) | 80 (78%) | n/a | 80 (70%) | n/a |
Source: Bright MLS. Includes Ocean City and West Ocean City closed sales over $50,000.
Month Median Price Trend
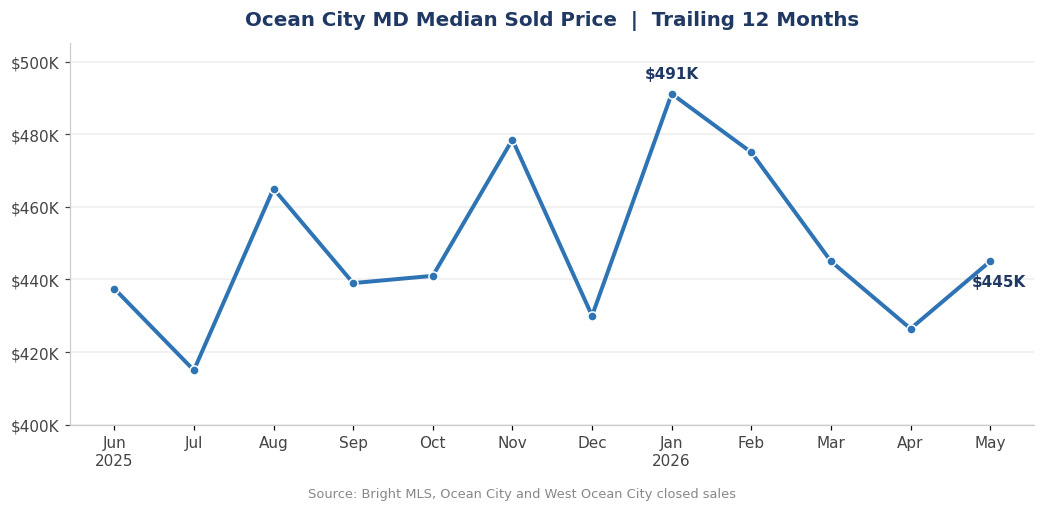
Median sold price by month, June 2025 through May 2026. Source: Bright MLS, Ocean City and West Ocean City.
Is the Ocean City market up or down? Up. May 2026 closed 117 sales at a $445,000 median, with volume up 7% and prices up 6% year over year.
Here's The Simple Version
More properties sold.
Prices rose.
Buyers had more choices.
Cash buyers remained active.
And well-priced properties continued to attract strong attention.
That is the simplest explanation of May.
What The Numbers Tell Us
Price Strength Is Real
The median sold price increased 6.0% year over year.
Price per square foot increased 6.0% year over year.
When both metrics move together, it confirms that the gain reflects actual appreciation rather than simply a shift toward more expensive properties selling.
That's an important distinction.
It tells us values are genuinely moving higher.
May Was The Strongest Month Of 2026
Closings have steadily increased throughout the year:
- January: 60 sales
- February: 81 sales
- March: 97 sales
- April: 102 sales
- May: 117 sales
The pending activity we highlighted last month translated directly into closed sales.
That's exactly what we expected.
Inventory Is Finally Having An Impact
This is probably the most important trend for buyers and sellers to understand.
Inventory now sits at approximately 4.5 months of supply.
That is the deepest level we've seen in this dataset.
More inventory means more competition.
More competition means buyers can be selective.
That's showing up in days on market.
Median days on market increased from 34 days to 44 days.
But here's the nuance many people miss:
More than one-quarter of all May sales went under contract in 10 days or less.
At the same time, 16 properties sat on the market for six months or longer.
Those slower listings pulled the average upward.
The market isn't slowing equally.
It's separating.
Well-priced properties are moving.
Overpriced properties are sitting.
Market Commentary
One thing we hear frequently from both buyers and sellers is:
"How can inventory be rising if prices are still going up?"
The answer is that inventory is only one side of the equation.
Demand matters too.
And demand remains healthy.
A growing inventory doesn't automatically create a buyer's market.
It creates options.
What buyers do with those options determines what happens next.
So far, buyers continue to show a willingness to pay strong prices for properties that are properly priced and properly positioned.
That's why median prices, price per square foot, and list-to-sale ratios all remain strong.
Ocean City Sub-Market Breakdown

Sales By MLS Location
| Location | Sales | Median Price | Avg $/Sq Ft | Avg DOM |
|---|---|---|---|---|
| Direct Oceanfront | 21 | $591,000 | $576 | 62 days |
| Oceanfront Indirect View | 7 | $699,900 | $525 | 55 days |
| Ocean Block | 20 | $327,500 | $464 | 84 days |
| Bayside Interior | 31 | $415,000 | $357 | 81 days |
| Bayside Waterfront | 20 | $375,000 | $425 | 75 days |
| West Ocean City | 18 | $586,000 | $261 | 83 days |
Key Takeaways By Segment
Direct Oceanfront Reawakened
Direct Oceanfront jumped from 13 sales in April to 21 sales in May.
That segment was largely responsible for April's softer year-over-year comparisons.
Its return played a significant role in May's stronger performance.
Bayside Interior Led The Market
With 31 sales, Bayside Interior once again produced the highest transaction volume.
Its median price climbed to $415,000, reflecting a stronger mix of larger bayside units than we saw in April.
West Ocean City Remains Strong
West Ocean City posted 18 sales with a median price of $586,000.
Its lower price-per-square-foot figure reflects product type rather than weakness, as larger single-family homes dominate the segment.
Ocean Block And Bayside Waterfront Stayed Active
Both segments recorded 20 sales each and continue to represent strong middle-market opportunities for buyers looking for value relative to oceanfront inventory.
Oceanfront Indirect View Produced The Highest Median
At $699,900, Oceanfront Indirect View posted the highest median price.
However, with only seven sales, buyers and sellers should be cautious about reading too much into a small sample size.
Street Location Breakdown
One of the more interesting trends in Ocean City real estate is how dramatically performance can vary by location.
Buyers often focus on the building itself, but location remains one of the strongest drivers of long-term value, rental demand, appreciation potential, and resale performance.
Sales By Street Range
| Area | Sales | Median Price | Avg $/Sq Ft |
|---|---|---|---|
| South of 28th Street | 17 | $420,000 | $452 |
| 29th to 60th Street | 21 | $369,900 | $477 |
| 61st to 90th Street | 13 | $480,000 | $468 |
| 91st to 120th Street | 23 | $415,000 | $467 |
| 121st Street & North | 25 | $440,000 | $404 |
| West Ocean City | 18 | $586,000 | $261 |
What This Means
A few patterns stand out once the numbers are in.
Midtown carries the highest price per square foot on the island. The 29th to 60th Street corridor led at $477 per square foot, even though its median sold price ($369,900) was the lowest on-island figure. That combination reflects a heavier mix of smaller condos rather than softer pricing.
North Ocean City was the busiest on-island stretch. The 91st Street and north corridors combined for nearly half of the island's sales, generally offering larger floor plans and quieter surroundings, with medians in the $415,000 to $440,000 range and a lower price per square foot.
West Ocean City carried the highest median at $586,000. Its low price per square foot ($261) reflects larger single-family homes rather than discounts.
Downtown, south of 28th Street, held steady at 17 sales and a $420,000 median, and continues to draw buyers and investors who prioritize proximity to the Boardwalk.
Price Range Analysis
Inventory is growing, but not equally across every price point.
Understanding where buyers are active can help both buyers and sellers position themselves more effectively.
| Price Range | Sales |
|---|---|
| Under $250K | 5 |
| $250K to $399K | 40 |
| $400K to $599K | 42 |
| $600K to $799K | 14 |
| $800K to $999K | 10 |
| $1M+ | 6 |
The Story Behind The Numbers
The heart of the Ocean City market continues to live between $250,000 and $600,000.
That segment accounted for approximately 70% of all May sales.
Why?
Because it represents the sweet spot for:
- Second-home buyers
- Vacation home buyers
- Investment property buyers
- First-time beach property buyers
The luxury market remains active as well.
Six properties closed above $1 million during May, confirming continued strength at the top end of the market.
What has changed is buyer scrutiny.
Luxury buyers remain active.
They're simply demanding stronger value, better condition, and more realistic pricing than they did during the pandemic-era frenzy.
Bedroom Count Analysis
Bedroom count continues to have a meaningful impact on pricing, demand, and marketability.
| Bedrooms | Sales | Median Price |
|---|---|---|
| Studio | 2 | $243,450 |
| 1 Bedroom | 21 | $307,500 |
| 2 Bedroom | 42 | $413,750 |
| 3 Bedroom | 34 | $540,500 |
| 4+ Bedroom | 18 | $722,500 |
Key Takeaways
Two-bedroom properties remain the backbone of the Ocean City real estate market.
They offer:
- Broad buyer appeal
- Strong vacation rental demand
- Manageable ownership costs
- Better inventory selection
Three-bedroom properties continue attracting both families and higher-end investors seeking stronger rental potential and greater flexibility.
At the luxury end, four-bedroom and larger properties remain the scarcest segment and continue commanding premium pricing, with a median of $722,500.
Notable Sales From May

Several transactions stood out during May and help illustrate where buyer demand remains strongest.
2 15th St #505 (Miramar), Ocean City - $1,600,000
3BR | Direct Oceanfront | 207 Days on Market | Closed at 98% of asking
The month's top sale. A premium oceanfront unit that found its buyer after an extended marketing period, a reminder that even the best locations sell when the price meets the market.
14100 Wight St #101 (Elbow Beach), Ocean City - $1,490,000
3BR | Direct Oceanfront | 1 Day on Market | Closed at 100% of asking
Priced right and gone in a single day at full price. The clearest example of the pricing-discipline message this month.
13028 Old Bridge Rd, Berlin (West Ocean City) - $1,480,000
4BR | Single-Family | 3 Days on Market | Closed at 101% of asking
A West Ocean City seven-figure single-family sale that closed above asking in three days. West OC's larger-home product continues to draw buyers.
1533 Teal Dr, Ocean City - $1,275,000
5BR | Bayside Interior | 28 Days on Market | Closed at 117% of asking
The bidding-war story of the month, closing well above list. A reminder that competition is alive on the right property.
6 62nd St #202 (Ocean Whisper), Ocean City - $1,145,100
4BR | Ocean Block | 30 Days on Market | Closed at 92% of asking
A large ocean block unit that negotiated to a number both sides could live with.
These sales reinforce an important theme throughout this report:
Properties offering strong value, unique features, exceptional condition, or premium locations continue attracting aggressive buyer attention.
Pending Sales & June Outlook

One of the strongest leading indicators in real estate is what's already under contract.
At the end of May:
- 168 properties were pending or under contract
- Pending volume remained elevated
- Showing activity remained healthy
- New inventory continued entering the market
Those are generally positive signals heading into June.
Why June Could Be Strong Again
The current pipeline suggests June has the potential to produce another healthy month of closings.
That doesn't mean every segment will outperform.
But the overall market appears to have sufficient buyer demand to absorb the growing inventory supply.
As always, we'll know more once the numbers are finalized.
But right now, the leading indicators remain encouraging.
Will June be strong in Ocean City? The leading indicators point that way. 168 properties were pending or under contract at the end of May, with 128 carrying agreements signed in May or later.
Cash Buyers Continue To Shape The Market

Approximately 32% of May buyers paid cash.
That figure remains remarkably consistent with historical Ocean City trends.
Why does this matter?
Cash buyers create:
- Faster transactions
- Greater certainty
- Stronger negotiating leverage
- Reduced financing risk
Ocean City has always attracted a higher percentage of cash buyers than many traditional residential markets because:
- Second-home ownership is common
- Retirement buyers are active
- Investors remain involved
- Many buyers are using proceeds from prior real estate sales
For sellers, understanding the role of cash buyers remains an important part of pricing and negotiation strategy.
What percent of Ocean City buyers pay cash? About one in three. 32% of May 2026 closings were cash purchases, in line with the roughly 30% to 37% range over the past year.
What This Means For Buyers Right Now
If you're a buyer, this is probably the healthiest market environment we've seen in several years.
You have:
- More inventory
- More negotiating opportunities
- Less competition
- More time to evaluate options
That doesn't mean every property is a bargain.
Far from it.
The best properties still move quickly.
But buyers now have the ability to compare, analyze, and negotiate in ways that were difficult during 2021 and 2022.
One thing we've been telling buyers repeatedly this spring:
Don't confuse a more balanced market with a weak market.
The market remains healthy.
It's simply more rational.
For many buyers, that's actually good news.
What This Means For Sellers Right Now
For sellers, the message is straightforward:
Pricing matters more than it did a year ago.
Condition matters more than it did a year ago.
Presentation matters more than it did a year ago.
The market is still rewarding good properties.
It's simply less forgiving of unrealistic expectations.
The sellers achieving the strongest results today are typically:
- Pricing close to recent comparable sales
- Presenting properties well
- Addressing deferred maintenance
- Marketing aggressively
- Responding quickly to market feedback
The days of simply naming a price and waiting for multiple offers have largely passed.
But well-positioned properties continue performing very well.
Frequently Asked Questions

Is Ocean City Currently A Buyer's Market Or Seller's Market?
Ocean City currently sits in a more balanced market environment than we've seen in recent years. Inventory has increased, giving buyers more options, while continued price appreciation and strong demand continue supporting sellers.
Are Ocean City Condo Prices Still Rising?
Yes. Median sold price increased 6.0% year over year in May 2026, while average price per square foot also increased 6.0%, confirming genuine market appreciation.
Why Are Days On Market Increasing If Prices Are Rising?
Growing inventory has given buyers more choices, allowing them to be more selective. Well-priced properties continue selling quickly, while overpriced listings often remain on the market longer, increasing average marketing times.
Is Now A Good Time To Buy In Ocean City?
For many buyers, yes. Inventory levels are higher, competition is lower than during the pandemic years, and buyers have greater negotiating leverage while still participating in a market that has shown continued long-term appreciation.
Are Cash Buyers Still Important In Ocean City?
Absolutely. Roughly one-third of May buyers paid cash, making cash transactions a significant factor in the local market.
What Types Of Properties Are Selling Fastest?
Properties that are properly priced, well maintained, in desirable locations, move-in ready, and backed by strong amenities or views continue attracting the fastest buyer response.
Market Outlook
As we move into summer, the Ocean City real estate market appears to be transitioning toward something many buyers and sellers haven't experienced in several years:
Normal.
Inventory is healthier.
Negotiations are more common.
Buyers have choices.
Sellers still have opportunities.
Prices continue rising, but at a more sustainable pace.
From our perspective, that's a positive development.
Healthy markets create confidence.
And confidence tends to support long-term stability.
The biggest thing we'll be watching next month is whether inventory growth begins to outpace buyer demand.
So far, demand continues holding up remarkably well.
Why You Can Trust This Report
Unlike many market reports that rely solely on automated national datasets, this report combines:
- Bright MLS sales data
- Active market participation
- Buyer consultations
- Seller consultations
- Showing activity
- Inventory analysis
- Contract activity
- Nearly three decades of firsthand Ocean City real estate experience
This report is designed to provide practical market intelligence, not sensational headlines.
The goal is simple: help buyers, sellers, investors, and property owners better understand what's actually happening in the Ocean City real estate market.
About The Author
Grant Fritschle is a second-generation Ocean City Realtor and co-founder of The Fritschle Barker Group at Keller Williams Realty of Delmarva.
With nearly 30 years of experience and more than 2,000 personal transactions, Grant specializes in:
- Oceanfront condominiums
- Waterfront homes
- Investment properties
- Vacation homes
- Luxury real estate
- Resort market analysis
Grant is also co-owner of Central Reservations, one of Ocean City's largest vacation rental management companies, providing him with a unique perspective on both property ownership and rental performance.
His market reports combine real-world transaction experience, local market expertise, and MLS data analysis to help consumers make informed decisions.
Related Ocean City Real Estate Resources
Data Source: Bright MLS. Statistics reflect closed sales reported through May 31, 2026 for Ocean City and West Ocean City MLS areas. Figures may be revised as additional sales are reported.
Trust Source Disclosure: This report was researched, written, reviewed, and interpreted by real members of The Fritschle Barker Group. Artificial intelligence tools may be used for editing, formatting, readability enhancements, and content refinement. All market analysis, observations, and opinions reflect local expertise, MLS data, and firsthand experience serving Ocean City and Delaware beach real estate clients.
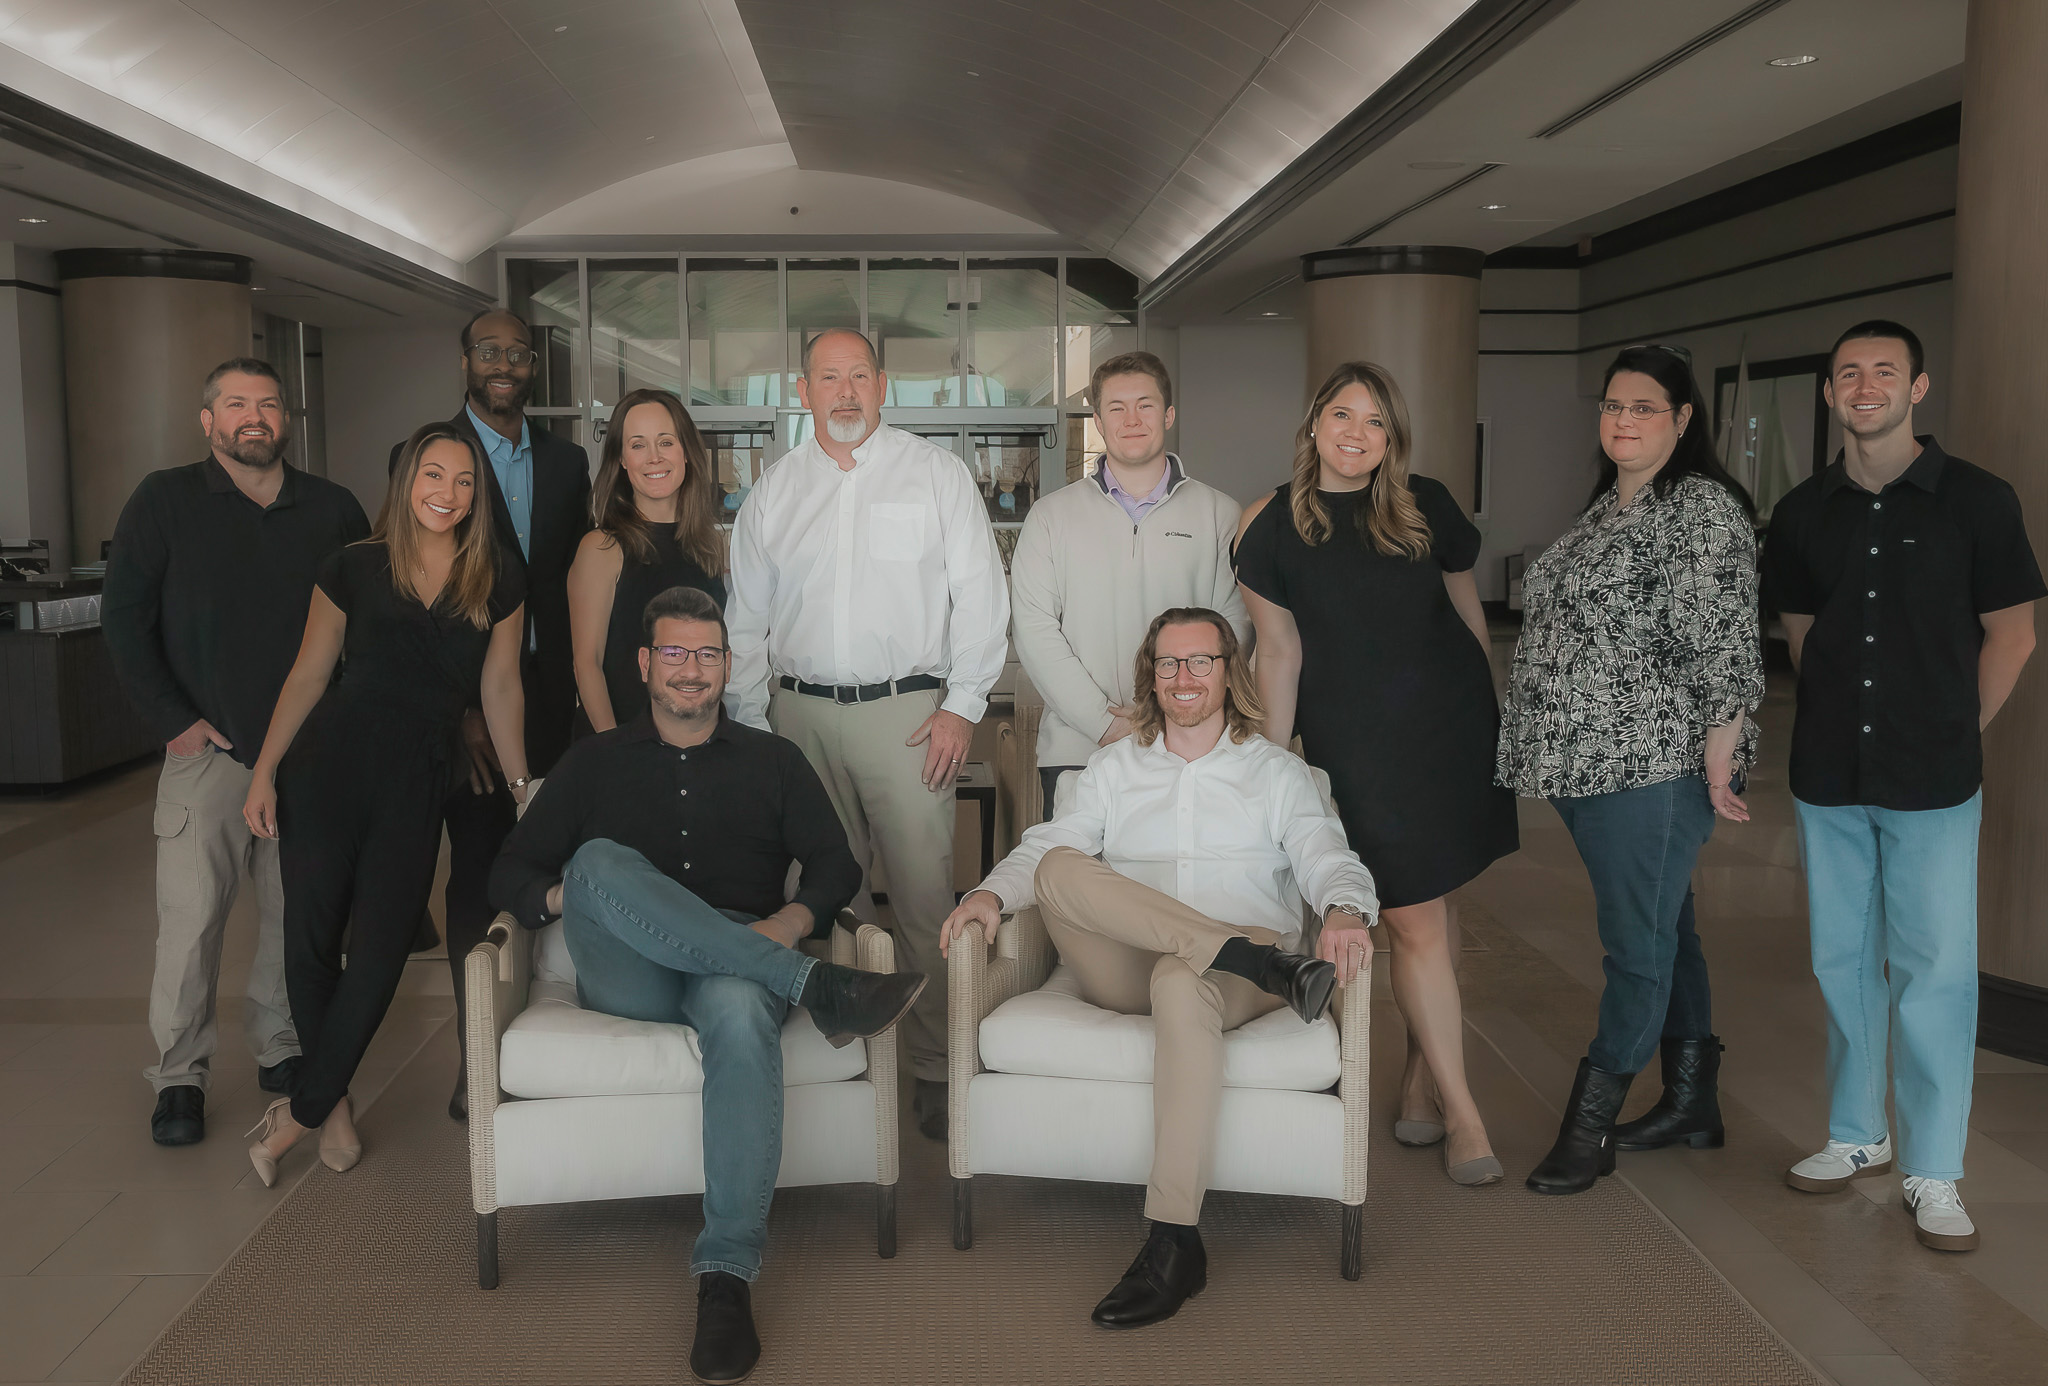

Your Top Ocean City, MD Real Estate Agents
Today, they are recognized nationally as a top-performing group of charismatic, skilled Agents deeply connected to the vibrant towns of the Eastern Shore. More than agents, they are trusted advisors and community advocates, blending local knowledge with national strategy to deliver exceptional results.
The Fritschle Barker Group at Keller Williams Realty of Delmarva adheres to all Fair Housing Act guidelines and NAR ethical standards.