Ocean City MD vs Fenwick Island DE: Where Should You Buy? | 2026 Guide
Trying to choose between Ocean City, Maryland and Fenwick Island, Delaware? They sit side by side on the same barrier island, yet they offer two very different versions of beach ownership. This is the honest head-to-head from a team that works both sides of the state line every week.
Quick Answer: If your goal is to find a property with a broad rental income potential, and a wide selection of price points, and easy access to lots of restaurants and activities, Ocean City MD is where you'll want to focus. If you want a quieter beach-retreat and a more exclusive (and pricier) real estate footprint, Fenwick Island, DE fits better. Both are excellent. They just suit very different buyers.
Jump To Section
The 30-Second Take
At The Fritschle Barker Group, we field this question almost every week. Most buyers already have a gut feeling, but they want the data to confirm it. Here's the honest side-by-side, pulled from Bright MLS data across the last 2.7 years for both markets.
| Ocean City, MD | Fenwick Island, DE | |
|---|---|---|
| Town size | ~10 miles long, ~7,000 year-round residents | ~1 mile long, ~400 year-round residents |
| Closed sales (last 999 days) | 3,071 | 97 |
| Average monthly transactions | ~96 | ~3 |
| Active / UC / pending inventory | 680+ | ~26 |
| Median closed price (all) | $440,000 | $1,270,000 |
| Median detached home | $625,000 | $1,999,000 |
| Median days on market | 32 | 23 |
| Vibe | Resort energy, boardwalk, plenty of things to do | Quiet, residential feel, long beach days |
| Rental income potential | Broad, deep market | Narrow and more restricted market |
| State sales tax | 6% (MD) | 0% (DE) |
The short version: Ocean City offers a lot more options, and steadier income potential. Fenwick gives you scarcity, quiet, and a higher price of entry.
Geography: They Share a Border
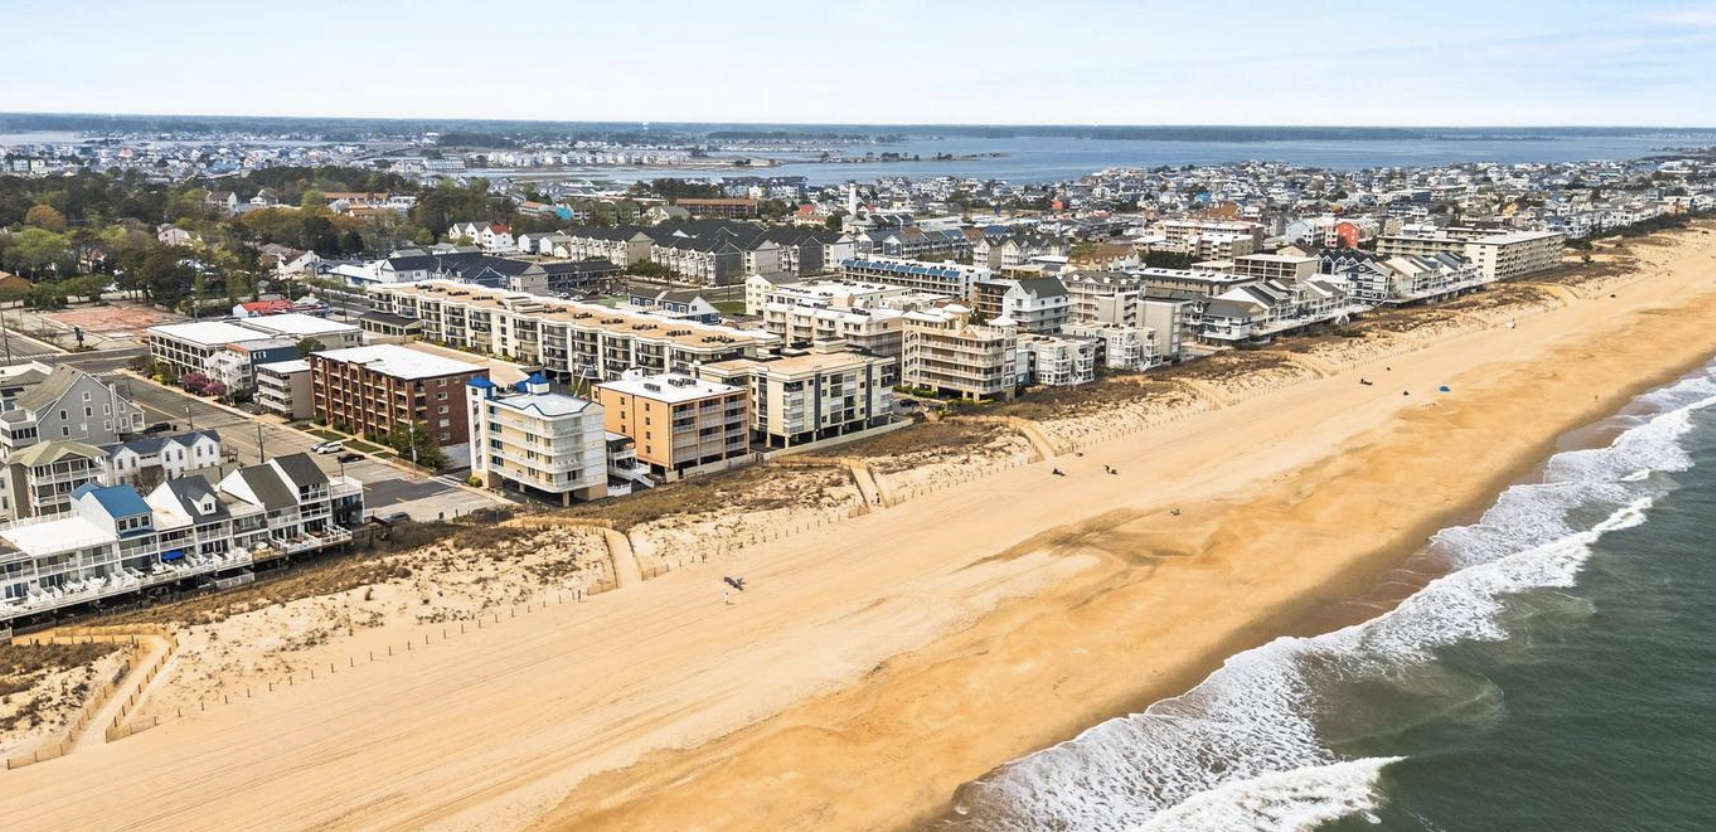
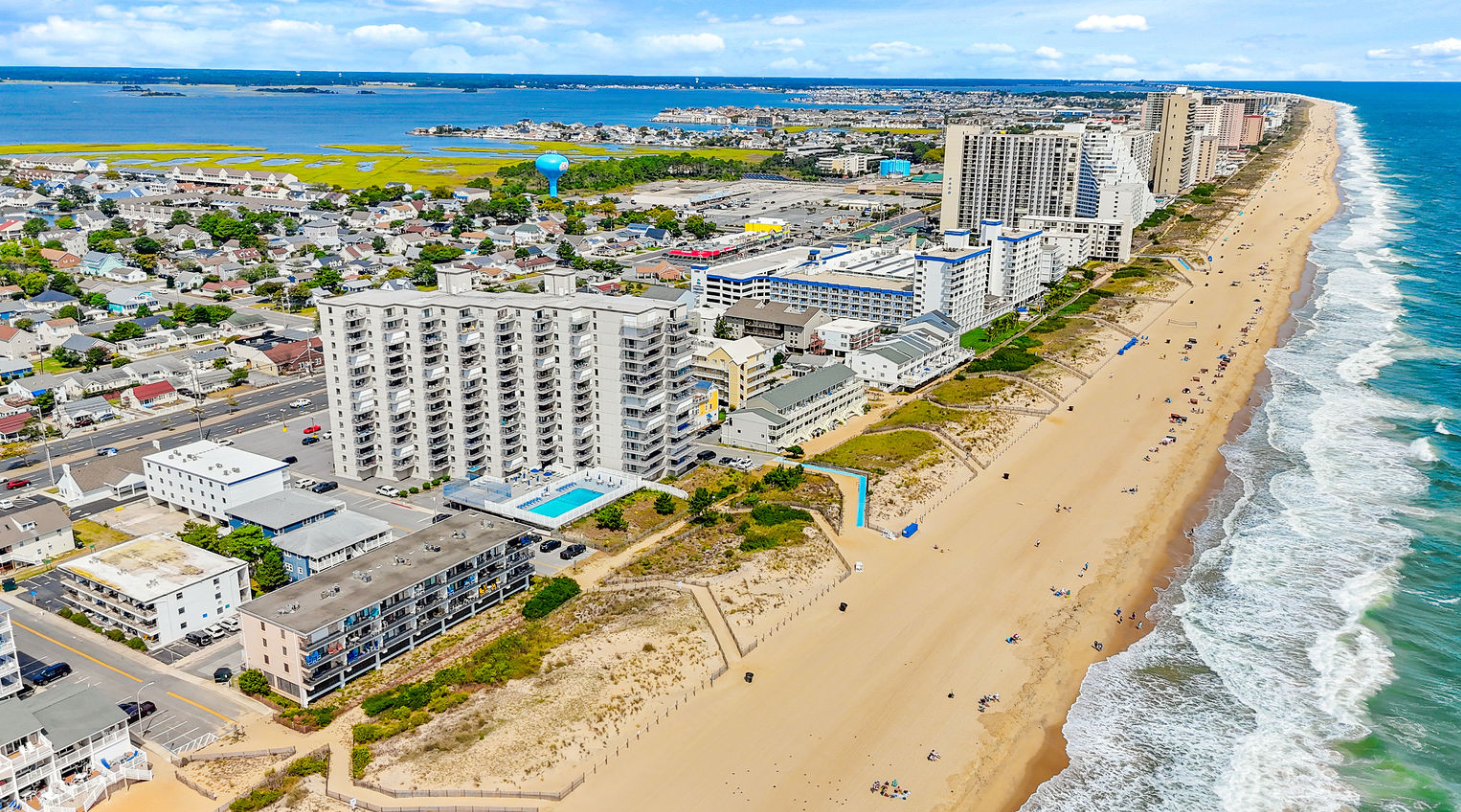
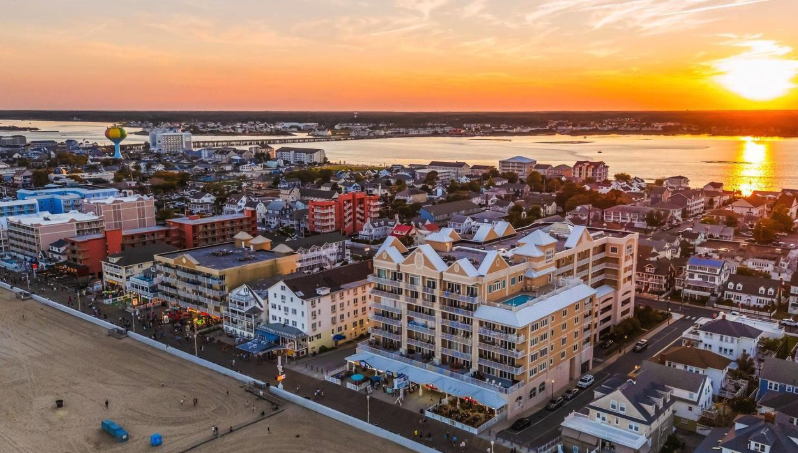
Fenwick Island sits directly north of Ocean City on the same narrow barrier island. Stand at 146th Street in OC and you're seconds away from the Delaware state line. Step across it and the tone of the street changes immediately.
Most first time beach shoppers can glance over how close the two towns actually are. A Fenwick homeowner can be at Seacrets or Fagers in about 15 minutes. An OC owner can be at Catch 54 or Fenwick Island State Park just as fast. The decision isn't about access to the other town... It's about which feel you want walking out your front door every morning.
For more on each area, our full Ocean City area guide and Fenwick Island community page cover the street-by-street specifics.
By the Numbers: Two Different Markets

How active are these markets?
Over the last 2.7 years, Ocean City recorded 3,071 closed sales. Fenwick Island recorded 97. That's roughly a 31-to-1 ratio in transaction volume.
What that means for you as a buyer:
- In OC, if you want a 2-bedroom oceanfront condo between $400K and $600K, you'll typically have a decent amount of options to tour!
- In Fenwick, you may wait months for a property that fits your criteria to hit the market. When one does, it sells fast: median 23 days on market vs. 32 in Ocean City.
This is the single biggest practical difference for buyers. Fenwick rewards patience. Ocean City rewards decisiveness on the right property.
What does each dollar buy?
The condo gap is smaller than most people expect. The detached home gap is where the real price story lives.
| Property Type | Ocean City, MD | Fenwick Island, DE |
|---|---|---|
| Detached home (Single Family) | $625,000 | $1,999,000 |
| Townhome | $568,000 | $1,048,000 |
| Condo / Unit Flat | $402,500 | $489,000 |
| Waterfront property | $510,000 | $1,425,000 |
Why the gap? Fenwick has very few condo buildings compared to OC's dense high-rise and mid-rise inventory, and single-family lots within town limits are genuinely scarce.
Lifestyle: The Real Decision

Price and inventory tell you what you can buy. Lifestyle tells you what you'll actually want to live with.
Ocean City, MD
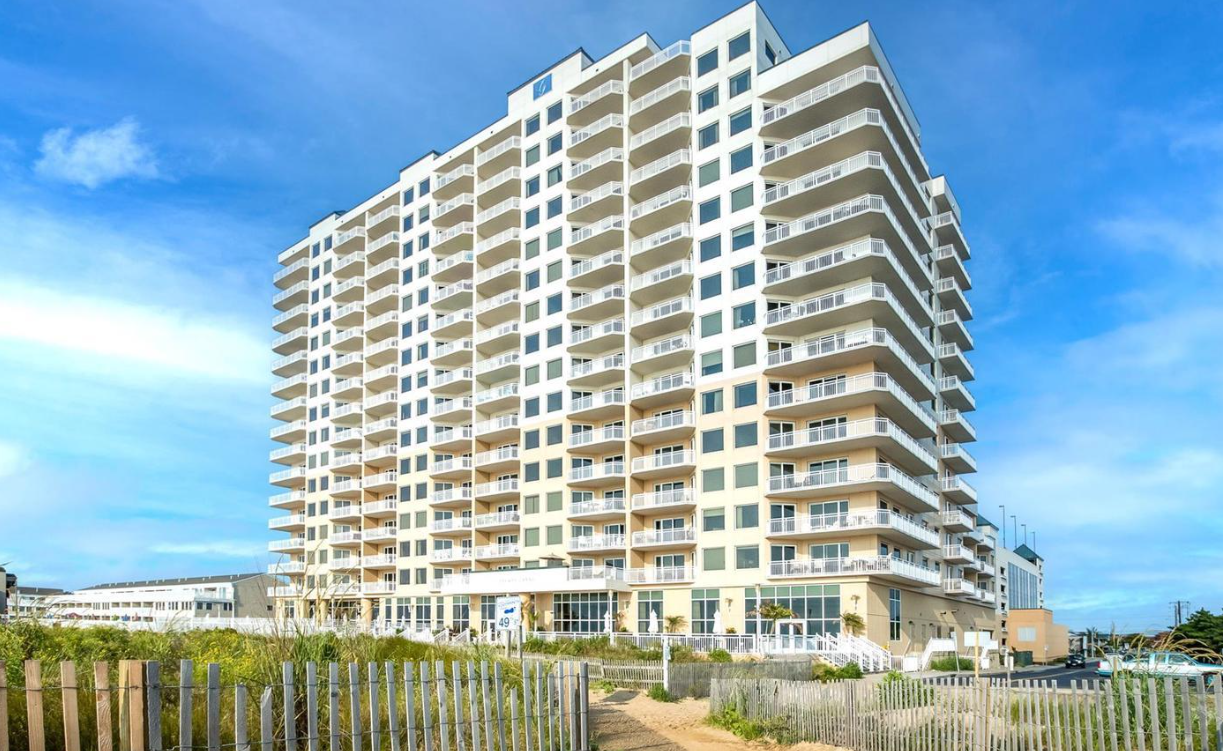
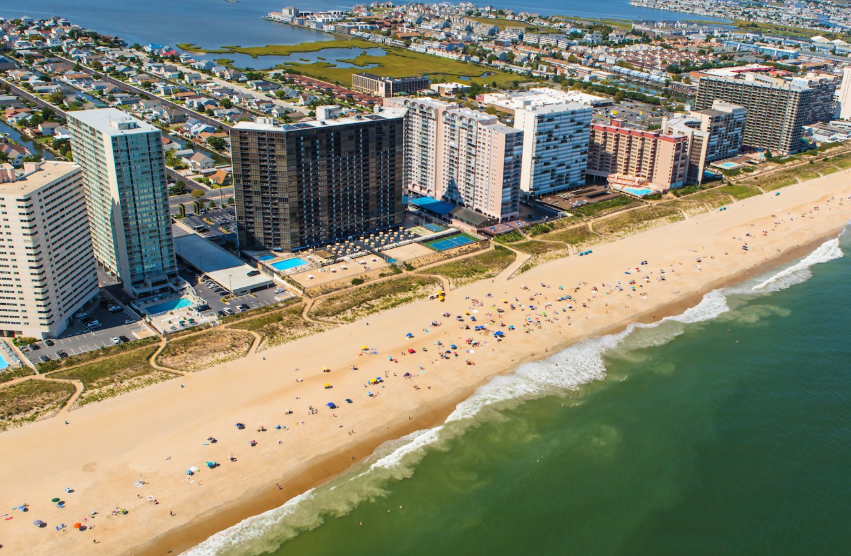
Ocean City is, and always has been, a resort town. That's not a knock. It's the identity. You get:
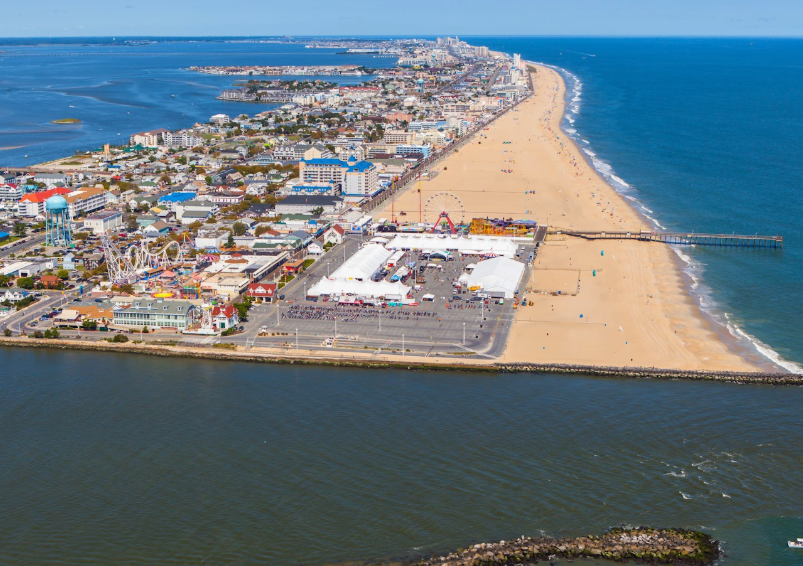
- A 3-mile boardwalk with Thrasher's fries, Candy Kitchen, and Trimper Rides
- Hundreds of restaurants, from raw bars to fine dining
- Popular nightlife spots (Seacrets, Fager's Island, and more)
- Every water sport you can name: fishing, surfing, paddleboarding, parasailing
- Year-round events: Oceans Calling, White Marlin Open, Winterfest of Lights
If you love being part of things, OC delivers. For help narrowing down which stretch of town fits you, our guide to which part of the OC beach area is best breaks it down block by block. And if you're thinking about making it a primary residence, start with what it's actually like to live in OC.
Fenwick Island, DE
Fenwick is the opposite pace. It's a one-mile-long beach town with about 400 year-round residents. You get:
- Uncrowded beaches at Fenwick Island State Park
- A handful of excellent restaurants: Catch 54, One Coastal, Harpoon Hanna's
- Quiet residential streets with single family homes
- Easy access to Bethany, Rehoboth, and OCMD
- The historic Fenwick Island Lighthouse, bayside paddleboarding, and long beach-walk mornings
If "peace and quiet" is the top line item on your wish list, Fenwick will feel right. For the full local flavor, see our Fenwick Island things-to-do guide and top restaurants list. Our broader Delaware beaches overview puts Fenwick in context with Bethany, Dewey, and Rehoboth.
If You're Buying for Rental Income

This is where the two markets diverge sharply. It's worth being direct.
Ocean City is a rental-friendly market. Most condo buildings permit short-term weekly rentals, and the OC tourism calendar supports a deep rental season with growing shoulder-season demand. Gross rental income in the right building can cover a meaningful share of carrying costs.
Fenwick is more restrictive. The town is primarily residential in character, and most properties trade as owner-occupied homes or second homes rather than income-producing rentals. Delaware also introduced a 4.5% state tax on residential short-term stays. Stacked on Fenwick's local rental tax (reduced to 7.5% for 2026), that's roughly a 12% combined lodging tax on short-term rentals.
Our bottom line: if rental income is a primary reason you're buying, OC is almost certainly the better fit. If it's a nice-to-have on top of a lifestyle purchase, Fenwick can still work, just expect a narrower rental window and tighter margins. For more on the OC side, see our vacation rental buyer's guide.
Taxes and Closing Costs
Delaware has no state sales tax. That's a real quality-of-life advantage for anyone furnishing or renovating a property. Over a 10-year hold, the cumulative savings add up.
Maryland levies a 6% state sales tax plus a 6% OC local lodging tax on rentals. MD also collects a state real estate transfer tax that's typically split between buyer and seller.
Property taxes shifted in Fenwick in 2025. Sussex County completed a court-ordered reassessment: rates reset downward, but assessed values reset upward to market. Net impact varies by property. OC and Worcester County taxes are more predictable year over year.
Here's what we tell clients: Buy where you want to live. The tax differences are real, but they shouldn't override which area fits your day-to-day life.
Which Is Right for You? A Simple Decision Framework

Ocean City is likely the better fit if:
- You want activity, nightlife, and a wide restaurant selection
- You want the option to rent out your property & cover a meaningful portion of your carrying costs
- You're buying in the $400K to $800K range and want real options
- You care about transaction volume (easier to buy and, eventually, sell)
- You love the boardwalk, events, and resort energy
Fenwick Island is likely the better fit if:
- You want a quiet, residential-feeling area
- You're buying primarily as a second home or primary residence, not an income property
- You're comfortable at a $1M-plus entry point for detached homes
- You're willing to wait for the right property to come to market
- You prefer long, uncrowded beach days over resort energy
Plenty of buyers feel pulled in both directions. That's fine. Some of our clients have owned in both markets at different life stages, and we've handled both sides of those moves. If you're still weighing it, our 2026 Ocean City real estate trends piece adds market-level context on the OC side.
Our Honest Take

Here's the truth from nearly three decades of working both sides of the state line: these aren't competing markets. They're complementary. They serve different buyers, different budgets, and different life stages.
Ocean City wins on inventory, income potential, and sheer variety. Fenwick wins on scarcity, calm, and a certain kind of exclusivity you can't manufacture in a resort town. Neither is "better." Both are excellent. The real question is which lifestyle you want to wake up in.
Grant grew up in this market. Many members of our team are licensed and active in both Maryland and Delaware, which matters if you're comparing across the state line or eventually transitioning between the two. We know which Fenwick blocks flood in nor'easters, which OC buildings have the cleanest HOAs, and which neighborhoods fit which families. When you're ready to pressure-test your decision with real local data, reach out or meet the team.
What Clients Are Saying

"If you are looking for a realtor in the areas of the MD/DE beaches you can stop your search here! Grant and his staff are incredible and will continue to impress you throughout your home buying process. The knowledge, attention to detail, prompt communication and overall passion for real estate Grant has is amazing."
Katie D., 5-star Google review on Grants Google Business ProfileFrequently Asked Questions

Is it cheaper to buy in Ocean City or Fenwick Island?
Ocean City is meaningfully cheaper on nearly every property type. Median closed fee-simple price is $440,000 in OC vs. $1,270,000 in Fenwick Island.
Does Fenwick Island allow vacation rentals?
Fenwick does allow rentals, but with meaningful restrictions and a combined lodging tax of roughly 12% on short-term stays.
Which has better beaches?
Both sit on the same Atlantic barrier island, so the sand and surf are similar. Fenwick's beaches at Fenwick Island State Park are less crowded. OC beaches are wider in many spots and offer more amenities: lifeguards, and boardwalk access / public bathrooms in downtown OC.
Is Ocean City or Fenwick quieter year-round?
Fenwick is substantially quieter year-round. OC has a larger year-round community but also more visitor traffic and event activity. If off-season quiet is a priority, Fenwick wins easily.
Can I use one real estate team for both markets?
Yes. The Fritschle Barker Group is active in both Maryland and Delaware, which is useful if you're comparing across the state line or planning to eventually move between the two.
How fast do properties sell in each market?
Median days on market: Ocean City, 32 days. Fenwick Island, 23 days. Fenwick moves faster because of scarcity, not because demand is higher in absolute terms.


Your Top Ocean City, MD and Fenwick Island, DE Real Estate Agents
Today, they are recognized nationally as a top-performing group of charismatic, skilled Agents deeply connected to the vibrant towns of the Eastern Shore. More than agents, they are trusted advisors and community advocates, blending local knowledge with national strategy to deliver exceptional results.

















.png)



















.png)