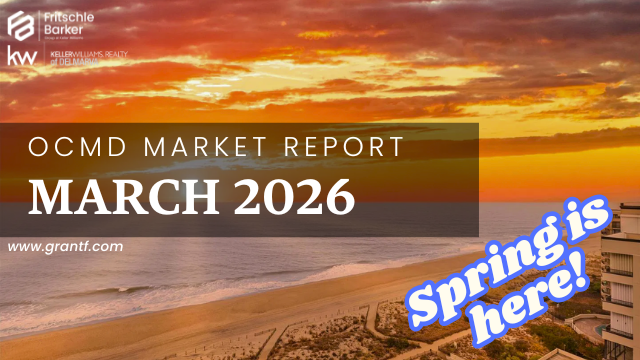
Ocean City MD Real Estate Market Report | March 2026
For newer and more updated numbers, see our Ocean City MD May 2026 Real Estate Market Report!
Spring has officially arrived in Ocean City, and based on what we saw in March, the real estate market got the memo.
After a solid February that showed early signs of momentum, March delivered 91 closed sales across Ocean City and West Ocean City, a 15.2% jump from the month before. Total dollar volume climbed to $48.0 million, up 22.6% from February and essentially flat with March 2025's $47.5 million. And here's the number that caught our attention: the median days on market dropped to just 37 days, down sharply from February's 68 and close to March 2025's 31.
Prices remain stable. The median sold price came in at $445,000, up slightly from March 2025's $431,000. Year over year, that is a 3.2% increase. Not a surge. Not a decline. Stability with a slight upward lean.
Whether you're browsing oceanfront condos for sale in Ocean City MD or considering a townhome across the bridge in West Ocean City, this report breaks down what actually happened last month, where the activity was, and what it means for your next move.
Our data is sourced directly from Bright MLS and includes all Ocean City and West Ocean City closed sales over $50,000. Let's get into it.
Jump To Section
- Quick Answer: How Is the Market?
- March 2026 Market Snapshot
- The Speed Story: Why Median DOM Tells the Real Tale
- Where Are People Buying? Sub-Market Breakdown
- What Sold by Price Range
- What Sold by Bedroom Count
- Notable Sales in March 2026
- What This Means for Sellers
- What This Means for Buyers
- The Rate Environment
- Market Outlook: What's Ahead
- FAQs: Ocean City MD Real Estate Market
- Client Testimonials
- Why You Can Trust This Report
Quick Answer: How Is the Ocean City MD Real Estate Market in March 2026?
The Ocean City, MD real estate market in March 2026 is showing clear spring momentum with stable pricing. There were 91 closed sales (down just 5.2% year-over-year from March 2025's 96, but up 15.2% from February), with a median sold price of $445,000, up 3.2% from last March's $431,000. Properties moved significantly faster, with a median of just 37 days on market compared to 68 in February. Direct oceanfront condos carried a median price of $544,500, while bayside interior properties offered entry points around $382,000. The list-to-sale ratio held steady at 97.1%, and 25% of properties sold at or above asking price, up from 20% in February. Mortgage rates climbed through March due to global uncertainty, ending the month around 6.4%, but local demand remained strong.
March 2026 Market Snapshot

Here's where the Ocean City real estate market stands as of the end of March 2026, compared to last month and the same month last year.
| Metric | Mar 2026 | Feb 2026 | MoM Change | Mar 2025 | YoY Change |
| Units Sold | 91 | 79 | +15.2% | 96 | -5.2% |
| Total Sold Volume | $47,982,600 | $39,131,469 | +22.6% | $47,450,113 | +1.1% |
| Median Sold Price | $445,000 | $468,500 | -5.0% | $431,000 | +3.2% |
| Average Sold Price | $527,281 | $495,335 | +6.4% | $494,272 | +6.7% |
| Avg. Price Per Sq Ft | $477 | $432 | +10.4% | $456 | +4.6% |
| Avg. Days on Market | 72 | 84 | -13.9% | 61 | +18.8% |
| Median Days on Market | 37 | 68 | -45.6% | 31 | +19.4% |
| List-to-Sale Ratio | 97.1% | 96.7% | +0.4 pts | 97.9% | -0.8 pts |
| Sold At/Above Asking | 23 (25%) | 16 (20%) | -- | 36 (38%) | -- |
| Sold Below Asking | 68 (75%) | 63 (80%) | -- | 60 (62%) | -- |
Data source: Bright MLS. Includes Ocean City and West Ocean City closed sales over $50,000.
A few things to unpack here. The month-over-month median price dip from $468,500 to $445,000 looks notable, but it's a product of mix shift. Bayside interior sales doubled in March (30 sales vs 15 in February), and those properties carry a lower price point that naturally pulls the overall median down. Year-over-year, the median actually climbed 3.2%, which is the more meaningful comparison.
The average sold price and average price per square foot are both elevated this month, pulled upward by a $4 million oceanfront land sale (more on that in the notable sales section). The median-based metrics tell the cleaner story.
Grant Fritschle, leader of The Fritschle Barker Group, sees it this way: "The spring market is here and it's right on schedule. Properties that are priced correctly are moving fast, and we're seeing more buyer activity now than we have in months. This market has highlighted those properties still trying to 'reach' for price, as the market is moving past them"
The Speed Story: Why Median Days on Market Tells the Real Tale
Here's something most competing market reports won't tell you about.
The average days on market in March was 72, which sounds moderate. But the median was 37 days. That's a significant gap, and it matters.
A handful of properties that had been listed for 150, 200, even 300+ days finally closed in March. Those long-running listings inflate the average. But the median tells you what the typical sale actually looks like: a property listed and under contract in just over a month.
For context, March 2025's median DOM was 31 days. We're close to that pace. February's 68-day median now looks like winter sluggishness, and March's sharp drop confirms that spring buying season is fully underway.
The takeaway: if you're a seller, don't be discouraged by the average DOM number. If your property is priced at recent comparable sales in your building, March's data says it should move in about a month. If it's sitting for 90+ days? That's a pricing signal, not a market signal.
Where Are People Buying? Sub-Market Breakdown

By MLS Location
| Location | Sales | Median Price | Avg $/Sq Ft | Avg DOM |
| Direct Oceanfront | 16 | $544,500 | $775* | 46 days |
| Oceanfront Indirect View | 6 | $531,250 | $530 | 77 days |
| Ocean Block | 16 | $422,000 | $462 | 110 days |
| Bayside Interior | 30 | $382,000 | $353 | 64 days |
| Bayside Waterfront | 21 | $477,000 | $435 | 75 days |
| West Ocean City | 2 | $744,500 | $349 | 42 days |
*Direct oceanfront avg $/sqft is elevated by the $4M land/teardown sale. Excluding that transaction, the segment's avg $/sqft is closer to $600. West Ocean City had just 2 closings in March. With volume this low, these figures represent individual transactions rather than a market trend.
A few key takeaways:
Bayside interior was the volume leader with 30 sales, double February's 15. This segment attracted the broadest buyer pool in March, with a $382,000 median that represents a meaningful jump from February's $295,000. That increase reflects more mid-range product closing, not a sudden spike in bayside values. Buyers at this price point are a mix of first-time beach buyers and vacation rental investors looking for an affordable entry into the Ocean City market.
Direct oceanfront moved the fastest at just 46 average days on market, and its $544,500 median stayed in the range buyers expect for direct ocean views. Demand for oceanfront product remains the most resilient segment in this market, month after month.
Bayside waterfront remained steady at 21 sales (compared to 20 in February), with a $477,000 median. These bay-view properties continue to attract both investors looking at vacation rental income and lifestyle buyers who want that sunset view.
Ocean block had 16 sales at a $422,000 median, though the 110-day average DOM suggests some older listings finally found their buyers in March.
By Street Location
| Area | Sales | Median Price | Avg Price |
| Downtown (1st-27th St) | 7 | $550,000 | $567,500 |
| Midtown (28th-93rd St) | 33 | $483,900 | $645,918 |
| North OC (94th St+) | 49 | $400,000 | $432,771 |
| West Ocean City | 2 | $744,500 | $744,500 |
North OC took the volume crown this month with 49 of 91 sales, a shift from February when midtown led the way. The $400,000 median reflects a concentration of more affordable condos in the upper reaches of the island. Midtown remained active with 33 closings, and its higher average price ($645,918) versus median ($483,900) tells you there were some premium sales pulling that number up. Downtown contributed 7 sales at a $550,000 median, consistent with the premium that boardwalk-adjacent properties carry.
What Sold by Price Range

| Price Range | Mar 2026 | Mar 2025 | Change |
| Under $200K | 1 | 3 | -2 |
| $200K - $299K | 19 | 24 | -5 |
| $300K - $399K | 16 | 14 | +2 |
| $400K - $499K | 19 | 15 | +4 |
| $500K - $599K | 12 | 13 | -1 |
| $600K - $749K | 14 | 14 | 0 |
| $750K - $999K | 5 | 8 | -3 |
| $1M+ | 5 | 5 | 0 |
The $200K-$299K and $400K-$499K ranges tied for most active with 19 sales each. Together with the $300K-$399K bracket (16 sales), these three mid-market ranges accounted for 59% of all March closings.
The $1M+ segment bounced back to 5 sales after February's thin month of 3. That's right in line with March 2025's 5 luxury closings, confirming that the luxury market is active when the right product hits.
The $200K-$299K range saw 19 sales, down from 24 a year ago. This could reflect thinning inventory at the lower end, a trend worth watching as affordable entry points become harder to find in Ocean City.
What Sold by Bedroom Count
| Bedrooms | Sales | Median Sold Price |
| Studio | 3 | $290,000 |
| 1 Bedroom | 17 | $300,000 |
| 2 Bedroom | 36 | $402,000 |
| 3 Bedroom | 29 | $620,000 |
| 4 Bedroom | 6 | $814,500 |
Two-bedroom condos remain the workhorse of this market at 36 sales (40% of all March activity), with a $402,000 median. They remain the sweet spot for vacation rental investors and second-home buyers looking for a balance of rental income potential and purchase price.
Three-bedroom units (29 sales at a $620,000 median) represented the move-up buyer. That median is actually up from February's $568,500, reflecting some premium 3BR product closing in March.
One-bedroom condos at a $300,000 median continue to offer the most accessible entry into Ocean City ownership, while the 6 four-bedroom sales at an $814,500 median show consistent demand in the family-sized segment.
Notable Sales in March 2026

Every month has its standout transactions. Here are the ones that caught our attention:
Acropolis, 6305 Atlantic Ave #301 - $1,475,000
3BR | Direct Oceanfront | 113 Days on Market
The top condo sale of the month. This oceanfront unit in the Acropolis commanded a premium, ultimately selling just $20K under its $1,495,000 asking price. Patient pricing paid off.
Gateway Grand, 2 48th St #401 - $1,125,000
4BR | Oceanfront Indirect View | 11 Days on Market
A building we know well. Grant Fritschle and Jon Barker co-founded The Fritschle Barker Group after leading the successful new construction sell-out of all 196 residences at The Gateway Grand, and the team continues to handle resales in the building. This 4BR unit moved in 11 days, proof of sustained demand for one of Ocean City's premier luxury condominiums.
Belmont Towers, 2 Dorchester St #405 - $1,122,500
3BR | Direct Oceanfront | 31 Days on Market
A south-end oceanfront unit in one of the boardwalk's most recognized buildings. Sold for 97.6% of asking price in roughly a month.
Rivendell, 121 81st St #810 - $810,000
3BR | Bayside Waterfront | 148 Days on Market
Rivendell is a no-rental building known for its premium owner-occupied community. The longer DOM here is typical for higher-end bayside waterfront product.
8303 & 8305 Atlantic Ave - $4,000,000
Direct Oceanfront | 1 Day on Market
The highest-dollar transaction of the month, though not a typical resale. This was a beach cottage (marketed as a teardown) and an adjacent vacant oceanfront lot, purchased together. The two lots are being consolidated for new construction: 4 oceanfront townhomes across 2 buildings, with the first unit already listed at $2.8 million. We include this in our dataset for completeness, but it skews the average price and $/sqft metrics. For that reason, the median-based figures are more representative of the broader market this month.
What This Means for Ocean City MD Home Sellers

If you're considering selling your Ocean City property in 2026, March's data reinforces a message we've been sharing for months:
- Price at the last comparable sale in your building. This is not a market where sellers can set their price anymore. If your neighbor's unit settled for $500K a year ago and you're in a comparable unit with similar updates, that's probably right around where you should be priced. The properties moving in 30 days or less? They were priced at recent comps. The ones sitting for 100+ days? Most were not.
- 75% of sales closed below asking. That's improved from February's 80%, and the list-to-sale ratio held at 97.1%. Sellers who price correctly are getting close to their number. Those who don't are giving buyers a reason to negotiate harder.
- Median DOM dropped to 37 days. That's nearly half of February's 68-day median. Correctly priced properties are not sitting. Spring momentum is real.
- Highlight your rental income. Buyers are evaluating purchases as investments. If your property has strong rental history through a reputable management company like Central Reservations, make that data front and center.
For more guidance, check out our guide on the top mistakes sellers make in Ocean City or read our full seller FAQ.
What This Means for Ocean City MD Home Buyers

If you're looking to buy real estate in Ocean City, MD, the March picture has some clear signals:
- You still have negotiating room, but the window is tightening. 75% of properties sold below asking, compared to 80% in February. As spring heats up, expect that gap to continue narrowing on well-priced listings.
- Don't watch from the sidelines too long. Median DOM dropped from 68 to 37 days in a single month. Properties are moving faster. The ones you're browsing this week may not be there next week if they're priced right.
- Bayside interior remains the value play. At a $382,000 median with 30 sales, this segment is where the most activity was in March. Many of these are in well-managed buildings with pools, elevators, and solid vacation rental programs.
- One-bedroom condos at $300K are your entry point. Seventeen of them sold in March. If you're looking to get into the market at the lowest price point, this is where to focus.
- Get pre-approved before you start looking. The Gateway Grand unit that sold in 11 days is not unusual anymore. In this pace, prepared buyers have an edge.
Browse oceanfront condos for sale in Ocean City MD or read our full guide on how buying a beach house can actually make financial sense. Contact our team for a personalized consultation.
The Rate Environment: What's Happening Nationally (and Why It Matters Locally)
You can't talk about March 2026 without acknowledging what's happening beyond the beach.
The U.S.-Iran conflict that began in late February has had a direct ripple effect on mortgage rates. Oil prices spiked, stock markets grew volatile, and the 10-year Treasury yield climbed, pushing 30-year mortgage rates from roughly 6.04% in early March to around 6.38-6.49% by month's end. The Fed held rates steady at its mid-March meeting, and with inflation reigniting on the back of energy costs, another rate cut is looking less likely in the near term.
So what does that mean for Ocean City?
Honestly, the local data tells us something encouraging. Even as rates ticked up through March, Ocean City saw more sales than February, faster closings, and improved list-to-sale ratios. This market has a resilience that's worth noting. Ocean City real estate is driven primarily by cash and second-home buyers who are less rate-sensitive than the typical primary-residence buyer. That doesn't make us immune to national headwinds, but it does provide a buffer.
Market Outlook: What's Ahead

Based on March's data and what we're feeling on the ground, here's where we see things heading:
- Spring momentum is real. The jump from 68-day median DOM in February to 37 days in March is not a fluke. We're heading into peak buying season, and the numbers confirm it.
- Prices are stable, and that's a good thing. The median is up 3.2% from a year ago and total dollar volume is essentially identical to March 2025. After the post-COVID correction, this market has found its footing. Neither a bubble nor a decline. Just steady.
- Our team is busier than the data shows. While this is not a data point, it's worth sharing: nearly every agent on The Fritschle Barker Group is deep in active buyer and seller transactions right now. Our pipeline of buyers and sellers ready to move in the coming weeks is the strongest it's been in months. That doesn't show up in March's closed numbers yet, but we expect it will in April and May.
- Mortgage rate uncertainty could actually help buyers. Rising rates are keeping some fence-sitters on the sidelines nationally. In a market like Ocean City, where a significant share of buyers pay cash or use second-home financing, that reduced competition can work in your favor.
- Inventory is building. Spring typically brings a wave of new listings. More choices for buyers, but also more competition if you're selling. For sellers, getting ahead of the summer inventory surge by listing now (and pricing correctly) is a smart play.
"We tell our clients the same thing every spring," says Grant Fritschle. "The market rewards preparation. Whether you're buying or selling, the people who come in with realistic expectations and a clear strategy are the ones who win. And right now, the data backs that up."
For our full 2026 forecast, read: Should You Buy in Ocean City MD in 2026?
FAQs: Ocean City MD Real Estate Market March 2026

How is the Ocean City MD real estate market performing in spring 2026?
The Ocean City real estate market is showing strong spring momentum. March 2026 saw 91 closed sales with a median sold price of $445,000, up 3.2% year-over-year. The median days on market dropped to 37, signaling that correctly priced properties are moving quickly as buyer activity increases heading into the warmer months.
What is the median home price in Ocean City, MD right now?
The median sold price in Ocean City, MD for March 2026 was $445,000. Prices vary significantly by location: direct oceanfront condos had a median of $544,500, while bayside interior units averaged $382,000. Browse homes and condos for sale in Ocean City.
How long does it take to sell a property in Ocean City, MD?
The median days on market in March 2026 was 37 days, a significant improvement from February's 68 days. Direct oceanfront properties sold fastest at an average of 46 days. Properties priced at recent comparable sales in their building tend to move within about a month.
Are home prices dropping in Ocean City, MD?
No. The median sold price in March 2026 ($445,000) was up 3.2% from March 2025 ($431,000). The market has stabilized after the post-COVID correction, with prices holding steady to slightly up rather than declining.
Is now a good time to buy in Ocean City, MD?
March 2026 data suggests buyers have negotiating room (75% of properties sold below asking) while also facing an accelerating market (median DOM dropped to 37 days). With mortgage rates around 6.4% and inventory building for spring, buyers who are prepared and pre-approved are in a strong position. Read our full guide: Should You Buy in Ocean City MD in 2026?
What is the best area to buy in Ocean City, MD?
It depends on your goals. Direct oceanfront ($544,500 median) offers premium views and top rental income. Midtown (28th-93rd St) is the most active market. Bayside interior ($382K median) is the most affordable entry point. Contact our team for personalized guidance based on your budget and goals.
Client Testimonials

"Grant was an excellent buyer's agent. We just purchased out first OC condo and it was clear that he knew every building inside and out. He didn't just open the door for us to tour, he provided invaluable insight into the building itself and HOA at each stop. He was quick to respond, communicated clearly, and helped us find the place that was right for us. He also provided excellent contractor recommendations. We would definitely work with Grant again." -- J. H. (6 weeks ago)
Check out more of Grant's Google reviews here!
Why You Can Trust This Report
This market report is produced by Grant Fritschle and The Fritschle Barker Group at Keller Williams Realty of Delmarva. Grant is a second-generation, lifelong Ocean City Realtor with over 20 years of experience in our coastal market. He grew up in Ocean City, was raised in the real estate business by his father Mark Fritschle, and co-founded The Fritschle Barker Group with Jon Barker after the successful new construction sell-out of all 196 residences at The Gateway Grand, Ocean City's premier luxury condominium.
Grant is also Owner/Broker at Central Reservations, a vacation rental management company serving the Ocean City market since 1978, giving our team a unique dual perspective on both the sales and rental sides of coastal real estate.
All data in this report is sourced directly from Bright MLS and analyzed by our team. We do not rely on automated valuation models or third-party estimates. Every insight in this report comes from our direct analysis of closed transaction data combined with what we're seeing on the ground every day.
Questions? Call Grant directly at 410-430-5880 or contact our team!


Your Top Ocean City, MD Real Estate Agents
Today, they are recognized nationally as a top-performing group of charismatic, skilled Agents deeply connected to the vibrant towns of the Eastern Shore. More than agents, they are trusted advisors and community advocates, blending local knowledge with national strategy to deliver exceptional results.
The Fritschle Barker Group at Keller Williams Realty of Delmarva adheres to all Fair Housing Act guidelines and NAR ethical standards.