Ocean City, MD Real Estate Market Report | August 2026
Last Updated: September 6, 2026. Based on closed Bright MLS sales in the Direct Oceanfront, Oceanfront Indirect View, Ocean Block, Bayside Interior, Bayside Waterfront, and West Ocean City MLS areas, 80 through 85, along with current active, pending, and under-contract inventory.
Jump To Section
- Quick Answer & Key Takeaways
- How to Read This Report
- August In One Minute
- Grant's Market Minute
- The Story Behind The Statistics
- What Most People Will Miss
- August 2026 Market Snapshot
- What The Numbers Tell Us
- Sub-Market Breakdown
- Street Location Breakdown
- Price Range Analysis
- Bedroom Count Analysis
- Notable Sales From August
- Pending Sales & September Outlook
- Cash Buyers
- Who Is Selling Right Now
- What This Means For Buyers
- What This Means For Sellers
- What This Means For Investors
- Frequently Asked Questions
- Three Things I'll Be Watching Next Month
- Grant's Market Compass
- Market Outlook
- Why You Can Trust This Report
Monthly Letters From the Market: a better way to understand the Ocean City real estate market, with more insight, more context, and more data from local experts.
Every month, the headlines try to summarize the Ocean City real estate market in a sentence or two. They focus on prices, inventory, interest rates, luxury sales, or national housing trends, and they are usually accurate as far as they go. What they rarely answer is the question buyers and sellers actually care about: what does all of this mean for me?
That is the purpose of these reports. The goal is not to publish another pile of MLS statistics, but to interpret what happened, explain why it happened, and help buyers, sellers, investors, and homeowners understand what those changes mean for their next decision. Data without context is just noise, so every report is built around one simple idea: the numbers matter, and understanding them matters even more.
Last Month We Said The Slowdown Was Real If July Stayed Small. It Stayed Small. Then August Happened.
The July report made a promise. It said July's 83 sales were preliminary, that the count would rise, and that if it rose only modestly, the slowdown was real and deserved more weight than we were giving it.
July rose by one. It finished at 84 sales, one late-reported settlement on the last day of the month. The median moved from $425,000 to $427,500. Everything else held. By the standard we set ourselves, July was a slow month, and this report says so plainly.
Then August closed at $512,000.
That is the highest monthly median in our data, which runs back to March 2023, and the first month in that stretch to clear $500,000. Ten properties closed at $1 million or more, after exactly one did in July. Dollar volume rose 58 percent month over month. The share of sales closing at or above asking rose to 35 percent, the highest of the year. The typical property found its buyer in about seven weeks, down from more than eight in July.
One month does not make a trend, and the August count is preliminary in exactly the way July's was: assembled four days after month-end, ahead of the late settlements that will push it up. But the shape of the month is not ambiguous. The luxury tier came back, the middle of the market kept doing what it has done all year, and buyers who found the right property in August were not waiting for prices to fall.
Quick Answer: How Is The Ocean City Real Estate Market Performing?
Quick Answer
The Ocean City and West Ocean City real estate market recorded 102 closed sales in August 2026, a preliminary figure that is expected to rise as delayed settlements are reported. That is up from July's revised 84 and compares with 111 in August 2025, a gap that should narrow once late-reporting sales are added.
The median sale price was $512,000, up 19.8 percent from July's revised $427,500 and up 10.1 percent against August 2025. It is the highest monthly median in this report series. The more reliable read is the twelve-month median, which sits at $455,000 for the year ending August 31, 2026, up 2.2 percent over the prior twelve months. A single month's jump in a resort market is mostly composition, and August's composition leaned hard toward the top: ten sales at $1 million and above, against one in July and nine in August 2025.
The negotiation picture stayed firm. Thirty-six of 102 sales, 35 percent, closed at or above asking price, up from 30 percent in July and the highest share of 2026. Median days on market fell to 48 from 59. Inventory stood at 511 active listings as of September 3, 2026, roughly 4.9 months of supply on the trailing three-month sales pace, which still describes a balanced market.
Key Takeaways
- August recorded 102 closed sales, preliminary and expected to revise upward, against July's revised 84 and 111 in August 2025.
- The median sale price was $512,000, up 19.8 percent from July and 10.1 percent year over year, the highest monthly median in this series.
- The twelve-month median through August 31, 2026 was $455,000, up 2.2 percent over the prior twelve months. That is the number to watch, not any single month.
- Ten sales closed at $1 million and above, after one in July, spread evenly across Direct Oceanfront, Bayside Waterfront, and West Ocean City.
- Thirty-five percent of sales closed at or above asking, the highest share of the year. The list-to-sale ratio was 97.0 percent.
- Median days on market fell to 48 from 59, while average days on market rose to 90 as several long-held listings finally cleared.
- Roughly 39 percent of buyers paid cash, up from 30 percent in July and in line with the 40 percent of June and 41 percent of August 2025.
- July's preliminary 83 revised to 84 and its median to $427,500. The July slowdown was real. It lasted one month.
- New this month: units held one to five years are listing at about 1.5 times the rate of units held ten years or more.
If you are weighing a move, the guides on what your Ocean City condo is worth and what $500,000 actually buys here are useful companions to this report.
How to Read This Report
August is a month where the headline numbers and the underlying signals point the same direction for the first time since spring, and that makes it easier to read than July. Three things still matter before drawing conclusions.
First, August's sales count is preliminary. The report was assembled four days after month-end. July was first reported at 83 and finished at 84; June was first reported at 126 and finished at 129; May was first reported at 117 and finished at 130. August's 102 will rise, and the year-over-year comparison against 111 should be read with that in mind.
Second, this is a resort market. A cluster of luxury transactions can move the average price and dollar volume dramatically, and August had ten of them. The median moved too, and that is more meaningful, but composition still explains part of it.
Third, medians and rolling twelve-month figures matter more than one-month averages. That is why this report gives weight to the twelve-month median, price per square foot, list-to-sale ratio, and days on market rather than treating one headline number as the whole story.
August In One Minute
The luxury tier came back, and it came back everywhere at once: three seven-figure sales on the oceanfront, three on the bayside waterfront, three in West Ocean City. The median crossed $500,000 for the first time in this series. The twelve-month median moved up, not sideways. Buyers paid at or above asking more often than in any month this year. The typical property sold faster than it did in July. The cash share rose with the luxury share, as it always does here. And the July slowdown, which we said we would take seriously if the count stayed small, stayed small and lasted exactly one month.
Grant's Market Minute
I want to start where I left off last month, because I made you a promise there.
I said that if July's count revised only modestly, the slowdown was real and deserved more weight than I was giving it. July revised from 83 to 84. One sale. So let me say it plainly: July was a slow month. Not a collapse, not a turn, but a real pause, and I am not going to pretend otherwise now that August looks good.
Here is what August tells me about that pause. It was the top of the market catching its breath. We were definitely busy in August, but honestly, it wasn't anything crazy. What changed was the top. Ten sales at a million dollars or more, and they were not concentrated in one building or one neighborhood. Three on the oceanfront. Three on the bayside waterfront. Three in West Ocean City. One on the ocean block. That spread matters more to me than the count, because it says the buyers at the top of this market were not waiting on one product type. They were waiting on the right property, and in August a number of them found it.
The number I care about most is not the $512,000 median, as good as that looks. It is the share of sales that closed at or above asking: 35 percent. That is the highest of the year, and it happened in a month with 102 closings, not a thin month where three good outcomes can move the figure. When more than a third of sellers get their number or better, buyers are not negotiating from strength. They are competing for the properties that are priced right.
The other number I am watching is median days on market, which came back down to 48 from 59. Last month I said that was the metric that moves before the price metrics do, and it moved the right direction. The average went up to 90, and I want to explain that rather than hide it: several listings that had been sitting for a very long time finally sold in August, one of them after more than two years on the market. When old inventory clears, the average jumps and the median does not. That is a healthy thing, not a warning.
The honest summary is that August was busy, strong at the top, steady in the middle, and faster than July almost everywhere. Not crazy. Just a good month. The count will rise. The question for September is whether the luxury tier keeps trading or whether August was the whole cluster.
The Story Behind The Statistics
Numbers answer one question. Interpretation answers another.
The question August raises is whether a sharp one-month rebound means more than the sharp one-month decline that preceded it, and the answer is that it means about the same amount, which is to say: not much on its own, and quite a lot in combination.
When a market genuinely strengthens, several things firm up together. The share of full-price sales rises, the typical property sells faster, the twelve-month figures tick up rather than just the monthly ones, and the top of the market participates rather than sitting out.
August did all four.
The average and the volume rose because the luxury tier was present, just as they fell in July because it was absent. But the median rose too, the twelve-month median rose, the share at or above asking rose, and the typical property sold eleven days faster. Those are not the fingerprints of composition alone. They are the fingerprints of a market that paused in July and resumed in August.
That distinction matters most for the people who own or are buying a typical Ocean City property. If you own a two-bedroom condo, the ten seven-figure sales have little bearing on what your unit is worth, and the two-bedroom median of $405,000 tells you that. What does bear on your unit is that buyers in August paid at or above asking more often than in any month this year, and that properties priced to the market moved in weeks rather than months.
What Most People Will Miss In These Numbers
Most reports will publish the $512,000 median and the 58 percent jump in dollar volume and stop there. Both are real. Both are also the two figures most likely to be misread.
Here is why.
Ten properties closed at $1 million or more in August against one in July. That cluster alone explains most of the jump in average price and volume, because ten seven-figure transactions carry enormous weight in a market where the typical sale is around $450,000. Strip the top ten out of August and the month looks like a good normal month, not an extraordinary one.
The second thing most people will miss is that the median moved for a reason the average did not. The median is not sensitive to the ten sales at the top; it is sensitive to the middle. The middle moved because the mix of what sold shifted toward three-bedroom properties, which led the month with 40 sales at a $602,500 median, and away from the one-bedroom and studio segment. Fewer entry-level closings and more large ones push the median up without any individual unit being worth more.
The third thing most people will miss is that August's count is not final. Every month this year has revised upward. Reading 102 against last August's 111 and concluding that sales fell year over year is the kind of conclusion that a revision erases thirty days later.
A surface reading says prices jumped 20 percent. A careful reading says the luxury tier returned, the product mix shifted toward larger properties, and underneath both of those the twelve-month trend moved up by a little more than 2 percent. The third statement is the one that describes what your property did.
August 2026 Market Snapshot
Here is where the Ocean City and West Ocean City housing market stands at the end of August 2026.
Important Note: July 2026 figures below reflect an upward revision from the originally reported 83 sales and $39.7 million in volume to 84 sales and $40.2 million after one late-reporting Bright MLS settlement was recorded. August's 102 sales are preliminary and are expected to increase as additional sales are finalized and reported. Every month-over-month comparison in this report should be read with that in mind.
| Metric | August 2026 | July 2026 (Rev.) |
|---|---|---|
| Units Sold | 102 | 84 |
| Total Sold Volume | $63,447,826 | $40,247,476 |
| Median Sold Price | $512,000 | $427,500 |
| Average Sold Price | $622,038 | $479,137 |
| Avg Price Per Sq Ft | $461 | $414 |
| Median Days On Market | 48 | 59 |
| Average Days On Market | 90 | 73 |
| List-To-Sale Ratio | 97.0% | 97.3% |
| Sold At/Above Asking | 36 (35%) | 25 (30%) |
| Sold Below Asking | 66 (65%) | 59 (70%) |
| Sales At/Above $1 Million | 10 | 1 |
Source: Bright MLS. Includes Ocean City and West Ocean City closed sales over $50,000. Medians of an even-numbered set fall on a half day and are rounded up (47.5 and 58.5).
The Twelve-Month View
Because a single month in a resort market can move a great deal without meaning very much, the more durable measure is the rolling twelve-month figure.
| Rolling Twelve Months | Sep 2025 to Aug 2026 | Sep 2024 to Aug 2025 |
|---|---|---|
| Closed Sales | 1,216 | 1,203 |
| Median Sold Price | $455,000 | $445,000 |
| Avg Price Per Sq Ft | $430 | $421 |
Is the Ocean City market up or down? Up, modestly. The twelve-month median through August 31, 2026 was $455,000, up 2.2 percent year over year, and price per square foot rose 2.1 percent over the same comparison. Monthly figures swing widely; the annual trend is steady and slightly positive.
Here's The Simple Version
August was a strong month at the top of the market and a normal one in the middle. The average and the volume jumped because ten luxury sales closed after a July with one. The median crossed $500,000 for the first time in this series, partly because larger properties made up more of what sold. Buyers paid at or above asking more often than in any month this year. The typical property sold in about seven weeks. The most important caveat is that the sales count is preliminary, and this report will look a little different in thirty days.
What The Numbers Tell Us
The Median Broke Its Range, And The Twelve-Month Trend Confirms The Direction
The median sale price landed at $512,000 in August, up from $427,500 in July. For a full year the monthly median had oscillated between $426,450 and $491,118 without establishing a direction. August is the first month to clear the top of that band, and it cleared it by more than $20,000.
That is worth stating plainly and then qualifying carefully. A one-month move of this size in a resort market is mostly a statement about what sold, not about what things are worth. August's mix leaned toward three-bedroom properties and away from one-bedroom units, and that alone lifts the median.
The twelve-month median is the cleaner instrument, and it reads $455,000 against $445,000 for the prior twelve months, up 2.2 percent. Price per square foot moved the same direction over the same period, from $421 to $430, up 2.1 percent. When those two measures agree, the read is dependable, and what they say is that Ocean City values are appreciating slowly and steadily rather than moving quickly in either direction. August did not change that. It confirmed it.
The Luxury Tier Came Back, And It Came Back Broadly
Ten properties closed at $1 million or more in August. One did in July. Nine did in August 2025.
What distinguishes August from June, the last month with a luxury cluster, is the spread. June's twelve included a nearly $4 million waterfront home that pulled the whole month with it. August's ten were distributed: three Direct Oceanfront, three Bayside Waterfront, three West Ocean City, one Ocean Block. Six of the ten were cash. The largest was a bayside waterfront home at $2.3 million that sold at full price in three days.
That distribution is the more informative fact. A luxury cluster in one building or one neighborhood is a story about that building. A luxury cluster across four sub-markets is a story about the buyers.
Buyers Paid Asking More Often Than In Any Month This Year
Thirty-six of 102 sales closed at or above asking price, 35 percent. That is up from 30 percent in July and 25 percent in June, and it beats August 2025, when 34 of 111 sales, 31 percent, cleared asking.
The list-to-sale ratio was 97.0 percent, essentially unchanged from July's 97.3 percent. Those two figures usually move together, and the fact that the ratio held flat while the at-or-above share rose tells you something specific: more sellers got their number, while the sellers who negotiated gave up a little more. That is a market sorting itself into two groups, correctly priced listings that clear at ask and ambitiously priced listings that clear at a discount, which is the same pattern the July report described from the other direction.
Days On Market Fell Where It Matters And Rose Where It Does Not
Median days on market fell to 48 from 59, back inside the range the market has held most of the year and shorter than August 2025's 50. That is the number that describes the typical property, and it moved the right direction.
Average days on market rose to 90 from 73. That is the number that describes the outliers, and August cleared several of them: listings that had been on the market well over a year finally sold, the longest after 794 days. When old inventory clears, the average jumps because those sales carry their full history with them, while the median barely notices.
The divergence is a healthy one. A market working through its stale inventory while the typical property sells faster is a market absorbing supply, not accumulating it.
Inventory stood at 511 active listings as of September 3, 2026, which works out to roughly 4.9 months of supply on the trailing three-month sales pace, or 5.0 months on August's preliminary count alone. Both describe a balanced market with genuine choice for buyers and no glut for sellers.
Ocean City Sub-Market Breakdown
Ocean City is not one single market, and that may be the most important thing to remember when reading any monthly report. Direct oceanfront condos behave differently than bayside waterfront properties, and West Ocean City single-family homes follow a different rhythm than Ocean Block condos.
With 102 recorded sales spread across six sub-markets, most categories carry enough transactions this month to read as signal. Two do not, and they are flagged below.
Sales By MLS Location
| Location | Sales | Median Price |
|---|---|---|
| Direct Oceanfront | 18 | $540,000 |
| Oceanfront Indirect View | 1 | $545,000 |
| Ocean Block | 24 | $390,000 |
| Bayside Interior | 18 | $366,500 |
| Bayside Waterfront | 30 | $592,450 |
| West Ocean City | 11 | $522,500 |
Bayside Waterfront Led For The Third Straight Month
With 30 sales at a $592,450 median, Bayside Waterfront was the busiest segment in the market for the third consecutive month, and it now accounts for nearly 30 percent of all activity. Median days on market was 50, right at the market figure, and price per square foot came in at $498.
Three of the month's ten seven-figure sales were bayside waterfront, including the largest sale of the month, and the segment also produced one of its fastest: a two-bedroom waterfront home that sold at full price the day it listed. The product range here runs from canal-view condos in the $300,000s to detached waterfront homes above $2 million, and August demonstrated demand across the entire span.
Ocean Block Was The Fastest Segment In The Market
Ocean Block recorded 24 sales at a $390,000 median with a median of just 28 days on market, the fastest of any segment and half the market figure. Price per square foot was $458.
That combination of accessible pricing and rapid absorption is what a healthy entry-to-mid segment looks like. Ocean Block properties trade on walkability to the beach without the oceanfront premium, and in August buyers at that price point were moving quickly on anything priced correctly.
Direct Oceanfront Held Its Premium And Its Volume
Direct Oceanfront recorded 18 sales at a $540,000 median and $635 per square foot, comfortably the highest price per square foot in the market and up from $548 in July. Volume recovered from July's 11 to 18, and three of the ten seven-figure sales were oceanfront, including a full-floor-plan four-bedroom at Gateway Grand that closed above its $2 million asking price in three days.
Median days on market was 42. The oceanfront premium is intact, and in August buyers were paying it without much hesitation.
Bayside Interior Was The Slow Corner Of An Otherwise Fast Month
Bayside Interior recorded 18 sales at a $366,500 median, again the most accessible segment on the island. But median days on market ran to 104, more than double the market figure, and the average was 150, because several of the long-sitting listings that finally cleared in August were here.
For buyers watching the affordable end, that is the most favorable combination in the report: real inventory, a median price a third below the market, and sellers who have had months to think about it.
Read The Small Samples With Caution
Oceanfront Indirect View recorded a single sale, at $545,000, and no conclusion should be drawn from one transaction.
West Ocean City recorded 11 sales at a $522,500 median and $290 per square foot. The price per square foot reflects larger homes on larger lots rather than any softness, and August's West Ocean City mix included three of the month's ten seven-figure sales. Its 81-day median on market is a fact about eleven properties, several of them large estates that take longer to match to a buyer, not a statement about the segment.
Street Location Breakdown
Location remains one of the strongest drivers of long-term value, rental demand, and resale performance in Ocean City real estate. Buyers often focus on the building first, and the building certainly matters, but street location still plays a major role in who a property appeals to, how it rents, how it resells, and how it feels to own.
Sales By Street Range
| Area | Sales | Median Price |
|---|---|---|
| South of 28th Street | 5 | $515,000 |
| 29th to 60th Street | 24 | $385,000 |
| 61st to 90th Street | 17 | $750,000 |
| 91st to 120th Street | 16 | $464,500 |
| 121st Street & North | 29 | $508,000 |
| West Ocean City | 11 | $522,500 |
What This Means
North Ocean City was again the busiest stretch of the island, but by a narrower margin than in July. The 91st Street and north corridors combined for 45 sales, about 49 percent of on-island activity, down from 59 percent in July as midtown recovered its share.
The 121st Street and north median rose to $508,000 from $372,000 in July, reversing the previous month's skew toward smaller units. Two of the month's seven-figure sales were up north, including the Atlantic Edge new-construction unit at 142nd Street.
The 61st to 90th Street corridor posted the highest median on the island at $750,000 on 17 sales. That stretch carried two seven-figure closings, at Carly E on Atlantic Avenue and a townhouse at 67th Street, along with a run of townhouses and condos in the $800,000 to $900,000 range. It is the corridor where larger floor plans and newer construction concentrate, and August's mix leaned that way.
The 29th to 60th Street corridor swung the other direction, to a $385,000 median on 24 sales from $567,250 in July. That corridor ranges from compact older condos to substantial oceanfront units, and this month's activity leaned compact. Its $468 per square foot says the underlying values did not move; the mix did.
Downtown, south of 28th Street, recorded only five sales at a $515,000 median and $591 per square foot, the highest per-square-foot figure of any corridor. Five sales is too few to read as more than texture.
The recurring lesson in Ocean City real estate is that a median by street range describes what sold, not what things are worth. When a corridor's median moves $100,000 or more in a month on two dozen sales, the mix changed. Price here is about product type, building mix, walkability, views, and rental demand as much as it is about distance to the ocean. If you are trying to narrow that down, choosing the right condo building deserves as much attention as choosing the corridor.
Price Range Analysis
Inventory is available across the market, but buyer activity is not spread evenly across every price point. Understanding where the sales are happening helps buyers gauge competition and helps sellers understand where their property fits.
| Price Range | August 2026 Sales |
|---|---|
| Under $250K | 8 |
| $250K to $399K | 28 |
| $400K to $599K | 30 |
| $600K to $799K | 19 |
| $800K to $999K | 7 |
| $1M and above | 10 |
The Story Behind The Numbers
The core of the Ocean City market still lives between $250,000 and $600,000. That band accounted for 58 of August's 102 sales, roughly 57 percent of the market, and it is where much of the everyday activity happens: second homes, vacation condos, entry-level beach properties, and investment-friendly units.
The two ends of the market traded places from July, and that is the most interesting thing in this table.
At the entry level, eight sales closed under $250,000, down from 15 in July, though up from five in August 2025. The under-$250,000 segment was unusually active in July and returned to a more typical pace in August. Buyers watching that segment should keep an eye on Ocean City properties under $250,000, where the inventory that does appear tends to move.
At the top, the $1 million and above band produced ten sales after one in July, and the $600,000 to $799,000 band held steady at 19. Together, the three bands above $600,000 accounted for 36 sales, 35 percent of the month, against 25 of 84 in July.
A market where the upper bands fill in while the core band holds its share is behaving in a specific and recognizable way. It says the buyers motivated by discretion and timing, who sat out July, decided that August was the month. The first group sustains a market. The second group decides how good a month looks.
Bedroom Count Analysis
Bedroom count continues to shape pricing, demand, marketability, and rental potential across Ocean City and West Ocean City.
| Bedrooms | Sales | Median Price |
|---|---|---|
| Studio | 4 | $260,000 |
| 1 Bedroom | 19 | $287,500 |
| 2 Bedroom | 27 | $405,000 |
| 3 Bedroom | 40 | $602,500 |
| 4+ Bedroom | 12 | $1,502,810 |
Key Takeaways
Three-bedroom properties led the market decisively in August with 40 sales at a $602,500 median, the second consecutive month they have outsold two-bedrooms and by a much wider margin than in July. Forty three-bedroom closings in a single month is a large number for this market, and it is the single biggest reason the overall median crossed $500,000.
Two-bedroom properties remain the backbone of the market with 27 sales at a $405,000 median, down from $425,000 in July. That is the figure most Ocean City condo owners should read as their market, and it moved little. The overall median jumped; the two-bedroom median did not. That gap is the clearest illustration in this report of how much composition drives the headline number.
At the entry level, one-bedroom units recorded 19 sales at a $287,500 median and studios recorded four at $260,000, together 23 sales against 17 in July. The affordable end stayed active even as the headline moved up.
At the top, four-bedroom and larger properties recorded 12 sales at a $1,502,810 median, up from seven sales at a $732,000 median in July. Nine of the twelve were seven-figure sales. This is where August's luxury cluster shows up most clearly, and it is the category that swung the average price and volume figures.
Notable Sales From August
Several August transactions illustrate where demand was strongest and how differently properties performed depending on price, positioning, and buyer perception.
311 South Heron Gull Court, Heron Harbour, Ocean City: $2,300,000
5BR | Bayside Waterfront | 3 Days on Market | Closed at 100% of asking | Cash
The largest sale of the month, and it required no negotiation at all. A detached waterfront home of about 3,700 square feet went under contract in three days at full price to a cash buyer. At this level, that outcome describes a property that was priced to what the market already believed it was worth, and a buyer who had been waiting for exactly it.
2 48th Street #706, Gateway Grand, Ocean City: $2,005,000
4BR | Direct Oceanfront | 3 Days on Market | Closed at 100.3% of asking | Cash
The clearest competitive result at the top of the market. A four-bedroom oceanfront unit closed above its $2,000,000 asking price in three days, which does not happen when high-end buyers are hesitating. It happens when a well-known building meets a well-priced listing and more than one buyer notices at the same time.
13014 Riggin Ridge Road, West Ocean City: $2,399,999
4BR | Single-Family | 12 Days on Market | Closed at 98.0% of asking
Twelve days to contract on a $2.45 million listing, closing within two percent of ask. West Ocean City's larger homes on larger lots do not usually move this quickly, and this one is a reminder that in August the top of the market was active in every sub-market, not just on the water.
9628 Oceanview Lane, Ocean City: $1,500,000
2BR | Bayside Waterfront | 0 Days on Market | Closed at 100.1% of asking | Cash
A two-bedroom detached waterfront home that sold at full price the day it listed, for cash. Bedroom count is not what this buyer was paying for. Waterfront position was, and the speed tells you how scarce that particular product is.
6301 Atlantic Avenue #301, Carly E, Ocean City: $1,455,000
3BR | Direct Oceanfront | 4 Days on Market | Closed at 97.3% of asking
Four days on market and a close within three percent of ask on a mid-island oceanfront condo. A normal negotiation at this level, and one more data point that the oceanfront premium was fully intact in August.
14 142nd Street #4, Atlantic Edge, Ocean City: $1,846,620
5BR | Ocean Block | New Construction
A new-construction unit in an eight-unit oceanside community at 142nd Street that settled above its original $1,599,000 list price. In new construction, a gap between list and settlement can reflect selections and upgrades added after contract, though there is no way to be sure of that from the record. Either way, it reads as a signal about demand for new product up north rather than about negotiation.
Together these sales reinforce the theme running through the entire report. In August, properties priced to the market moved in days, several at full price or better, and the top of the market participated in every sub-market at once. The gap between July's headline and August's is the gap between a month when the luxury buyers waited and a month when they did not.
Pending Sales & September Outlook
One of the strongest leading indicators in real estate is what is already under contract.
As of September 3, 2026, 118 properties were pending or under contract against 511 active listings, with an additional 32 listings in coming-soon status. The pending count is down from the 133 properties under contract on August 4, which is what you would expect after a month in which 102 of them closed. The active count is up slightly from 495.
The coming-soon figure is the one to notice. Seven listings were in coming-soon status at the start of August. Thirty-two were at the start of September. That is the fall listing wave arriving on schedule, and it will add to active inventory over the next several weeks.
That combination points toward a September with more choice for buyers and a pending pipeline that, while smaller than August's, is still substantial for a post-Labor Day month. A month with 118 contracts in hand typically produces a closed count in the range of recent Septembers, which ran 120 last year.
The honest caveat is that pending counts are a forecast, not a guarantee. Contracts fall through, financing gets complicated, and inspections change minds. But heading into September, the pipeline is healthy, the inventory is rising in the way it always does after Labor Day, and neither of those is a reason for alarm.
You can always compare against the July 2026 report to see how the trend is developing.
The September 2026 report is now available and picks up where this one leaves off.
Will September be strong in Ocean City? The pipeline suggests a normal early fall. As of September 3, 2026, 118 properties were pending or under contract against 511 active listings, with 32 more in coming-soon status as the fall listing season begins.
Cash Buyers Came Back With The Luxury Tier
About 39 percent of August buyers paid cash, 40 of 102, up from roughly 30 percent in July and in line with the 40 percent of June and the 41 percent of August 2025.
The explanation is the same one that has held all year: cash share and luxury activity move together in Ocean City, because high-end buyers, particularly in the seven-figure West Ocean City and waterfront segments, skew heavily toward cash. Six of August's ten seven-figure sales were cash. When the luxury tier trades, the cash share rises with it.
That matters because it changes who a seller is likely to be negotiating with.
In a month like August, a seller at the top of the market was more likely to encounter cash offers with shorter timelines and fewer contingencies, and the three-day closings above illustrate it. In the middle of the market, the buyer pool remained mostly financed, which means appraisals, lender condo reviews, and financing contingencies remain part of the conversation.
For buyers using financing, the practical guidance has not changed. A strong pre-approval, a lender who understands resort condos and their monthly fees, and a clear view of how a building's finances may affect the loan matter more than ever. Our guide to condo special assessments and the current lending rules covers what changed and when.
What percent of Ocean City buyers pay cash? In August 2026, about 39 percent, up from roughly 30 percent in July. The share tracks luxury activity closely and has run between 22 and 48 percent over the past year.
Who Is Selling Right Now: A Look At Ownership Tenure
This is a new feature in these reports, and as far as we know it has not been published for this market before.
We took every property listed for sale in the Ocean City and West Ocean City MLS areas as of September 3, 2026, and every property that closed in August, and matched them to Worcester County land records to find the date of the current owner's deed. That tells us how long the seller had held the property before deciding to sell. We then compared those sellers against every residential parcel in the same areas, to see whether some ownership cohorts are listing more often than others.
They are.
| Years since current deed | Share of all parcels | Share of listings on market | Listing rate |
|---|---|---|---|
| Under 1 year | 6.0% | 4.3% | 1.1% |
| 1 to 3 years | 13.1% | 16.8% | 2.0% |
| 3 to 5 years | 13.8% | 17.9% | 2.0% |
| 5 to 10 years | 26.6% | 26.9% | 1.6% |
| 10 to 20 years | 20.8% | 16.6% | 1.2% |
| 20 years or more | 19.7% | 17.5% | 1.4% |
Source: Bright MLS active, pending, and under-contract listings as of September 3, 2026, matched to Worcester County land records. 513 of 661 listings matched, 78 percent. Listing rate is the share of each cohort's parcels currently on the market. Overall rate, all cohorts: 1.6 percent.
The median property on the market has been held 6.2 years by its current owner. The median parcel in the market overall has been held 7.8 years. Sellers, in other words, are somewhat newer owners than the market as a whole, and the table shows where the difference comes from.
Properties held one to five years are listing at about 2.0 percent of their cohort. Properties held ten years or more are listing at 1.2 to 1.4 percent. That is a difference of roughly one and a half times, and it holds across enough parcels, more than 8,800 in the first group and more than 13,400 in the second, that it is not a fluke of a small sample.
Broken out by year of purchase, the pattern sharpens. Properties deeded in 2022 through 2024 are listing at 2.0 to 2.4 percent. Properties deeded in 2020 and 2021, the pandemic-era purchases that get most of the attention, are listing at 1.5 and 1.8 percent, close to the market average. The sellers of 2026 are disproportionately the buyers of 2022 through 2024, not the buyers of 2020.
The same pattern shows up in what actually closed. The median August seller had held the property 6.8 years, and 29 percent of August's matched sellers had owned for less than five years.
What this table does not tell you is why, and this report does not guess. Interest rates, insurance costs, condo assessments, changed plans, and the simple fact that a property bought at the 2022 peak has had less time to appreciate are all plausible, and the data cannot separate them. What the table does tell a seller is that the competition on the market right now skews toward recently purchased properties, which tend to be updated, priced with a specific number in mind, and owned by people with a clear reason to sell. What it tells a buyer is that a meaningful share of what is available was bought within the last five years, and the last sale price is a matter of public record.
We will run this table every month. Whether the pattern holds, shifts, or fades is the kind of question that only becomes answerable with repetition.
A note on method: the deed date is the last recorded transfer for each parcel, which includes transfers into trusts and between family members as well as arm's-length purchases, so a small share of "recent" deeds are not recent purchases. Entity and trust owners make up 18 percent of on-market listings and 23 percent of all parcels, so that effect does not appear to skew the comparison. Parcels without a street number, mostly vacant lots and common areas, are excluded from the base.
What This Means For Buyers Right Now
If you are buying in Ocean City or West Ocean City right now, August took away the argument for waiting.
In July, the case for patience was reasonable: the median had slipped, properties were sitting longer, and the top of the market was quiet. August reversed all three. Thirty-five percent of sales closed at or above asking, the highest share this year. The typical property sold in about seven weeks. And the buyers at the top of the market, who had been waiting, stopped waiting.
That does not mean every listing is competitive. The list-to-sale ratio held at 97.0 percent, which means the listings that were not priced to the market still closed at a discount, and the average days on market rose to 90 because several of them had been sitting for a very long time. The market is still sorting properties into two groups.
The opportunity is in the second group, and in the fall inventory that is about to arrive. Thirty-two listings were in coming-soon status at the start of September against seven at the start of August. More choice is coming, and the sellers who list in September and October in a resort market are usually the ones with a reason to sell before winter.
If I were buying today, I would move quickly on anything correctly priced in Ocean Block, where the median property sold in 28 days in August and the entry price is still under $400,000. I would look hard at Bayside Interior, where 18 sales closed at a $366,500 median and the median property took 104 days, a combination that describes real inventory and unhurried sellers. And I would be ready for the coming-soon wave, because a buyer who is pre-approved and knows what they want in the second week of September has more choice than they have had since spring.
Deciding whether the timing is right for you is its own question, and our take on whether buying here makes financial sense is a good place to start.
What This Means For Sellers Right Now
For sellers, August sent a message that is easy to overread inside an exciting headline: the market did not reprice by 20 percent, it rewarded correctly priced properties faster and more often than it had in months.
The properties priced to recent comparable sales did very well. Thirty-six of them got full price or better, and several of the month's largest sales went under contract in three days or less. What did not change is that the sellers who priced ahead of the market still closed at a discount, and the ones who had priced well ahead of it closed after a year or more of waiting.
The proof is inside August's own results. A $2.3 million waterfront home sold at full price in three days. A $2 million oceanfront unit sold above asking in three days. Meanwhile, the average listing that sold in Bayside Interior took 150 days, and the market's longest sale of the month took 794. Same market, different pricing decisions, very different outcomes.
The other thing worth understanding is the fall calendar. Thirty-two listings were in coming-soon status at the start of September. If you list in the next several weeks, you are listing into more competition than the summer had, and the buyers who remain active after Labor Day are more deliberate than the ones who shopped in June.
If I were selling today, I would price against August's closed sales in my sub-market rather than against August's headline, because the headline was made by ten properties and mine is probably not one of them. I would look at what my direct competition on the market paid for their property and when, because a seller who bought in 2023 and a seller who bought in 2009 are not going to negotiate the same way. And I would list before the coming-soon wave becomes the active wave, if I could be ready in time.
A current valuation, a look at how to prepare a condo for sale, and an honest review of the most common seller mistakes are the right starting points.
What This Means For Investors Right Now
For investors, August's report is about product selection at the top and steadiness in the middle.
The luxury tier returned with cash behind it, which raises the bar for a financed investor in that segment. The core $250,000 to $600,000 band accounted for 57 percent of August's sales, the two-bedroom median held near $405,000, and Ocean Block properties in that range sold in a median of 28 days. That is the part of the market where rental logic, price, and resale path most reliably line up.
The tenure data adds one practical point. A meaningful share of what is listed right now was bought within the last five years, which means the current owner's purchase price is recent, public, and a reasonable anchor for what they are hoping to net. That is useful information in a negotiation.
Investors using financing should expect the same things that mattered all year to matter more this fall: condo documents, fees, special assessments, building financing eligibility, rental rules, insurance, and realistic income assumptions. None of those got easier in August.
If I were evaluating an Ocean City investment property today, I would be less interested in whether August's median jumped and more interested in whether the building, location, fee structure, rental demand, and resale path make sense together at a price set by August's closed sales in that sub-market, not by August's headline.
Frequently Asked Questions

Did The Ocean City Real Estate Market Improve In August 2026?
Yes, on nearly every measure. Closed sales rose to a preliminary 102 from July's revised 84, the median sale price rose to $512,000 from $427,500, and 35 percent of sales closed at or above asking, the highest share of the year. Ten properties closed at $1 million or more after one in July. The twelve-month median rose 2.2 percent year over year. August's count is preliminary and is expected to be revised upward.
Why Are August's Sales Figures Called Preliminary?
Bright MLS settlements are reported on a lag, and this report was assembled four days after the month ended. Recent months illustrate the size of the effect: May was first reported at 117 sales and finished at 130, June at 126 and finished at 129, and July at 83 and finished at 84. August's 102 is expected to rise as delayed settlements are recorded, so the year-over-year comparison against 111 in August 2025 likely overstates any decline.
Are Ocean City Condo Prices Going Up?
Slowly. The monthly median jumped to $512,000, but that reflects a month heavy with three-bedroom and luxury sales. The two-bedroom condo median was $405,000, little changed from July. The twelve-month median through August 31, 2026 was $455,000 against $445,000 for the prior twelve months, and average price per square foot rose from $421 to $430 over the same comparison. Both point to steady appreciation of about 2 percent a year.
Why Did The Median Sale Price Jump So Much In One Month?
Because the mix of what sold changed. Forty three-bedroom properties closed in August against 27 two-bedrooms, and twelve four-bedroom-and-larger properties closed at a $1.5 million median. When larger properties make up more of the month's sales, the median rises even if no individual property is worth more. The twelve-month median, up 2.2 percent, is the better measure of what a typical Ocean City property did.
Is Ocean City Currently A Buyer's Market Or Seller's Market?
It remains balanced, with the advantage shifting toward correctly priced sellers. Inventory stood at 511 active listings as of September 3, 2026, roughly 4.9 months of supply on the trailing three-month sales pace, which gives buyers genuine choice. At the same time, 35 percent of August sales closed at or above asking price and the median property sold in 48 days, which tells us sellers who price correctly are achieving strong results quickly.
Which Ocean City Sub-Market Was Strongest In August?
Bayside Waterfront by volume, with 30 sales at a $592,450 median, its third consecutive month leading the market. Ocean Block by speed, with 24 sales at a median of 28 days on market. Direct Oceanfront by price per square foot, at $635. The luxury tier was spread across all three, with three seven-figure sales in each of Direct Oceanfront, Bayside Waterfront, and West Ocean City.
How Long Are Ocean City Properties Taking To Sell?
The median property took 48 days in August, down from 59 in July and shorter than the 50 days of August 2025. Average days on market rose to 90 from 73 because several listings that had sat for more than a year finally cleared, one after 794 days. The falling median is the meaningful figure; the rising average reflects old inventory being absorbed.
Who Is Selling In Ocean City Right Now?
Disproportionately, owners who bought within the last five years. Matching current listings to Worcester County land records shows properties held one to five years listing at about 2.0 percent of their cohort, against 1.2 to 1.4 percent for properties held ten years or more. Properties deeded in 2022 through 2024 are listing at the highest rate of any cohort. The median property on the market has been held 6.2 years, against 7.8 years for the market as a whole.
Why Do Your Market Reports Sometimes Differ From National Real Estate Websites?
National websites often rely on broad automated datasets, countywide figures, estimated values, or delayed public records. This report is based on closed Bright MLS sales in specific Ocean City and West Ocean City MLS areas, paired with firsthand interpretation from active local agents. That difference matters because Ocean City is a resort market with many micro-markets that can each behave differently in the same month.
Three Things I'll Be Watching Next Month
Every monthly report answers one set of questions and creates another. Heading into September, three stand out.
The first is whether the luxury tier keeps trading. Ten seven-figure sales in a month is a strong number for this market, and the question is whether August was a cluster of buyers who had all been waiting through July, or the start of a more active fall at the top. Two consecutive strong luxury months would tell a different story than one.
The second is where August's revised count lands. Every month this year has revised upward, and 102 against last August's 111 is a gap I expect to close. If August finishes near or above 111, the year-over-year picture is flat to slightly positive. If it finishes well short, the summer as a whole ran a little lighter than 2025 even with a strong August.
The third is the fall inventory. Thirty-two coming-soon listings at the start of September is the largest such figure we have recorded in these reports. If they convert to active listings and the median days on market holds under 50, the market is absorbing what it is given. If the active count climbs toward 550 while the median stretches back past 55 days, the fall will favor buyers more than August did.
Grant's Market Compass
A quick read on what strengthened, held steady, and softened in August.
Strengthening The share of sales closing at or above asking, seven-figure activity across four sub-markets, the monthly median, cash-buyer participation, three-bedroom demand, Ocean Block absorption speed, and the twelve-month median and price per square foot.
Holding Steady The list-to-sale ratio, two-bedroom condo values, the core price band between $250,000 and $600,000, the direct oceanfront price premium, overall inventory levels, and months of supply.
Softening Bayside Interior days on market, the count of entry-level sales under $250,000, the pending pipeline relative to August, and, for sellers listing this fall, the amount of competition arriving in coming-soon status.
The compass is pointing toward a market that resumed after a one-month pause. The direction is positive; the pace is the same slow, steady one it has been all year.
Market Outlook
Heading into the fall, the Ocean City real estate market is easier to read than it was a month ago, and the honest position is to say that the July question has been answered without pretending it was never a real question.
The headline data describes a strong rebound. The negotiation data, the twelve-month trend, and the sub-market detail all describe a market functioning normally at a slightly better pace than in the spring. For the first time since May, those signals agree.
What I am reasonably confident about is this: the middle of the market is stable and appreciating slowly, the top of the market is active again, and buyers who find a correctly priced property this fall should expect to compete for it rather than negotiate for it.
What I am not yet confident about is the fall inventory. Thirty-two coming-soon listings is a lot of supply arriving at once, and how the market absorbs it in September and October will tell us more about the next six months than August's median did.
That is a comfortable place to end a market report for a change. A month with a strong count, a broad luxury tier, and firm negotiation numbers is enough to say the summer pause is over. It is not enough to say anything about the winter, and that is exactly what we will be watching.
Why You Can Trust This Report
Unlike reports that rely solely on automated national datasets, this one combines Bright MLS sales data with active market participation: buyer and seller consultations, showing activity, inventory analysis, contract activity, pricing conversations, and nearly three decades of firsthand Ocean City real estate experience.
It also means being willing to say when the data is ambiguous, and to follow through when it is not. Last month this report said the July slowdown was real if the revised count stayed small. It stayed small, and this report says so. This month's count is preliminary too, and the year-over-year comparison should be read accordingly. Reporting a 20 percent monthly price jump without that context would be technically accurate and practically misleading, which is not a trade we are willing to make.
The goal is simple: help buyers, sellers, investors, and owners understand what is actually happening in the Ocean City real estate market, without sensational headlines or overly broad national assumptions.
Ocean City is a resort market, a condo market, an investment market, a second-home market, and a lifestyle market all at once, and those layers matter. Reading the numbers correctly requires more than pulling statistics from a database. It requires understanding how buyers think, how sellers respond, how buildings differ, and how individual micro-markets behave from one month to the next.
As Mary Ann H. put it after working with us on several transactions over the years:
"He knows the shore market better than anyone I know ... they appreciate Grant's knowledge and hard work from getting a signed contract to getting to settlement."
About The Author
Grant Fritschle is a second-generation Ocean City Realtor and co-founder of The Fritschle Barker Group at Keller Williams Realty of Delmarva. With 29 years of experience and more than 2,000 personal transactions, Grant specializes in oceanfront condominiums, waterfront homes, investment properties, vacation homes, luxury real estate, and resort market analysis. Jon Barker brings more than 20 years of his own experience to the team.
Grant is also co-owner of Central Reservations, one of Ocean City's largest vacation rental management companies, a financial interest disclosed here for transparency, and one that gives him a rare view of both property ownership and rental performance.
Related Ocean City Real Estate Resources
- Ocean City MD Real Estate Market Report | July 2026
- Gateway Grand Condo Guide
- Ocean City Condo Fee Guide
- Best Oceanfront Buildings on Highrise Row
- Second Home vs Investment Property Financing
- Ocean City Investment Property & Rental Income Guide
- Who Pays the Buyer's Agent in Ocean City
- Ocean City Real Estate Market Reports Archive
Data Source: Bright MLS. Statistics reflect closed sales reported through August 31, 2026 for Ocean City and West Ocean City MLS areas 80 through 85, over $50,000. August figures are preliminary and are expected to be revised upward as additional sales are reported. July 2026 figures reflect an upward revision from those published in the July report. Rolling twelve-month figures cover September 1, 2025 through August 31, 2026, compared against September 1, 2024 through August 31, 2025. Inventory, pending, under-contract, and coming-soon counts are as of September 3, 2026. Ownership tenure figures are derived from Worcester County land records as reflected in Bright MLS tax records, matched to listings by property address.
Trust Source Disclosure: This report was researched, written, reviewed, and interpreted by real members of The Fritschle Barker Group. Artificial intelligence tools may be used for editing, formatting, and readability. All market analysis, observations, and opinions reflect local expertise, MLS data, and firsthand experience serving Ocean City and Delaware beach real estate clients.
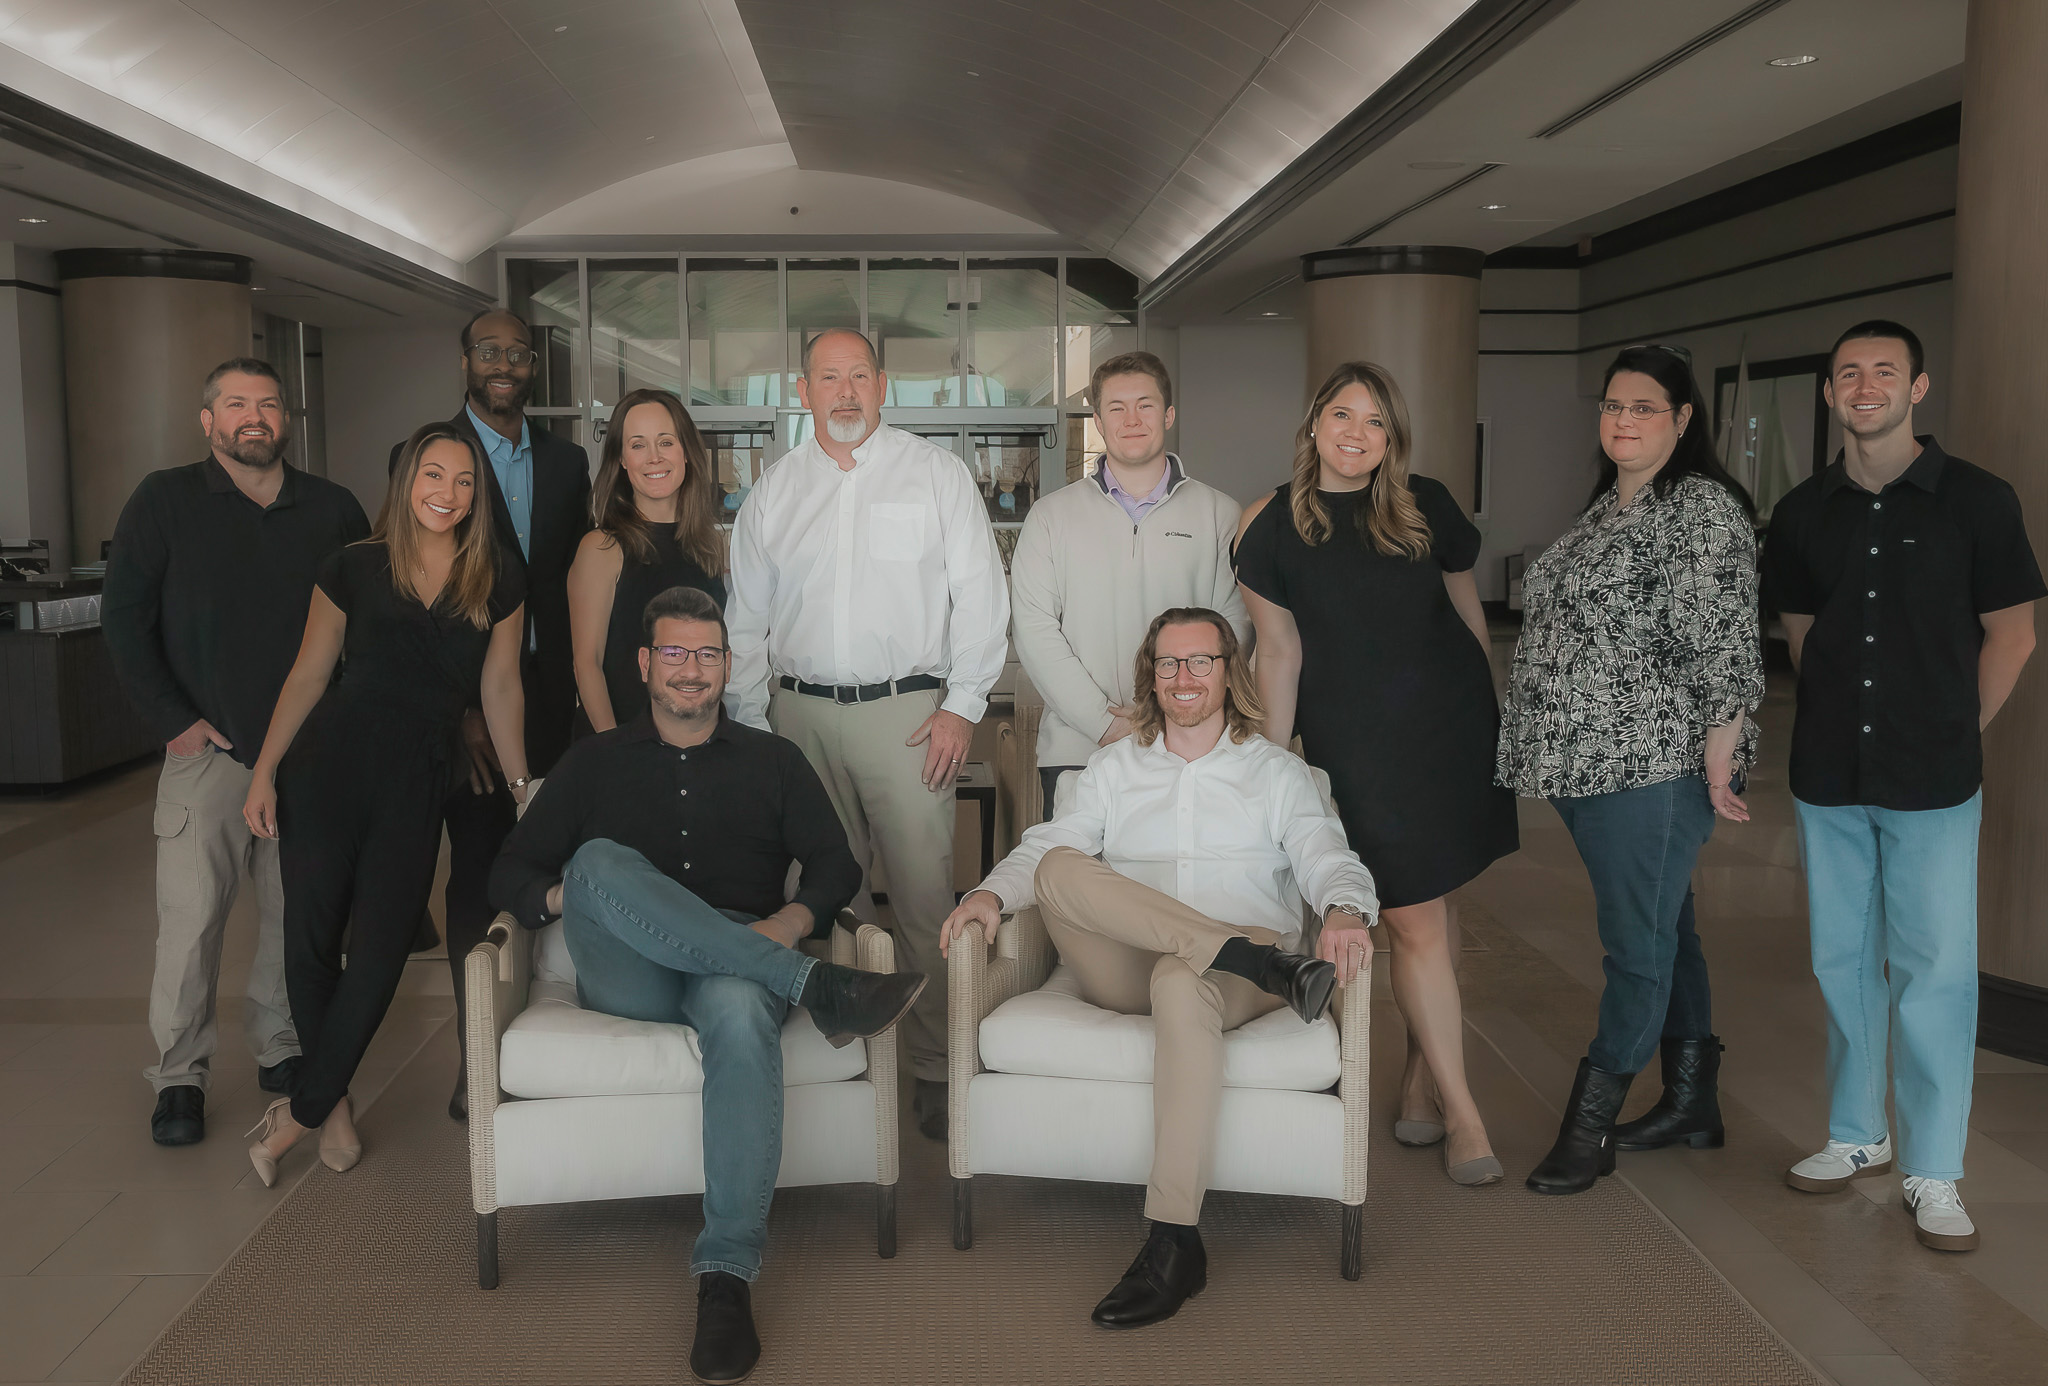

Your Top Ocean City, MD Real Estate Agents
Today, they are recognized nationally as a top-performing group of charismatic, skilled Agents deeply connected to the vibrant towns of the Eastern Shore. More than agents, they are trusted advisors and community advocates, blending local knowledge with national strategy to deliver exceptional results.
The Fritschle Barker Group at Keller Williams Realty of Delmarva adheres to all Fair Housing Act guidelines and NAR ethical standards.